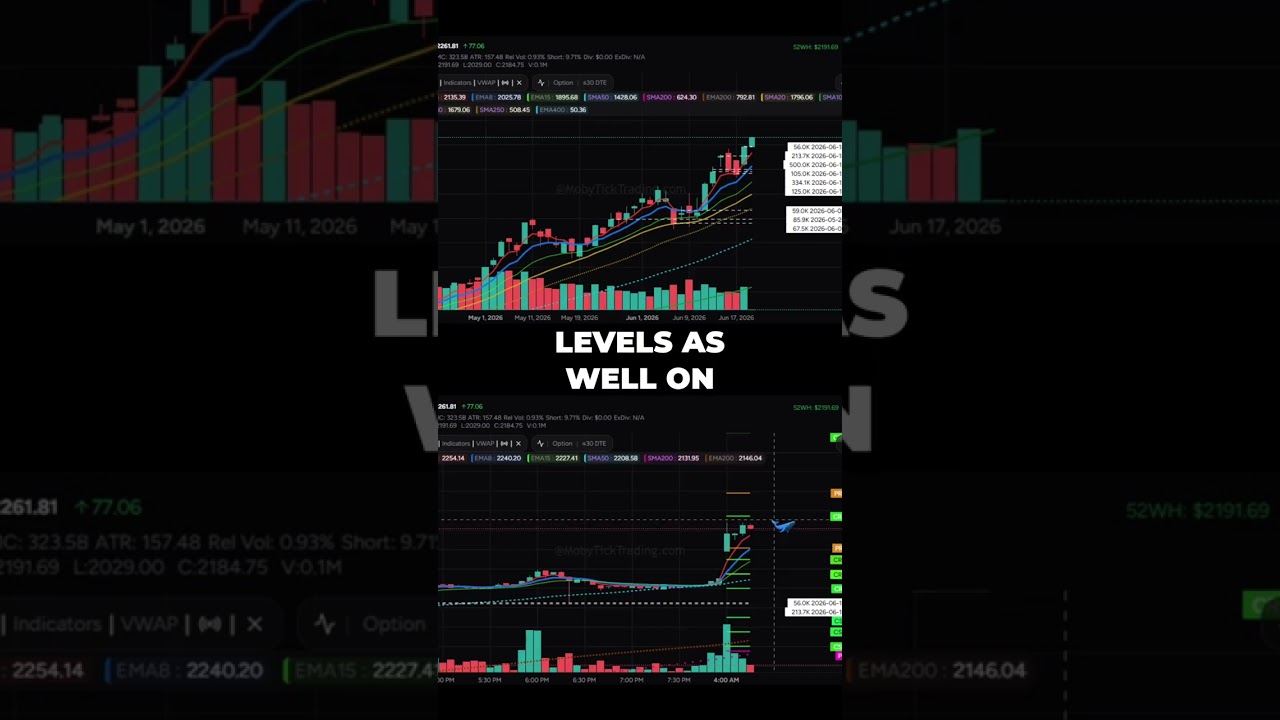
In this YouTube short, the analyst delivers a concise swing‑trade setup for a roughly $2,000‑price stock (Intel/SanDisk). He walks through recent price action, highlighting “prints” (clusters of trades) with increasing volume and minimal upper wicks as ideal entry zones. The commentary references the 4‑day exponential moving average (EMA), the 50‑day simple moving average (SMA), and the 200‑day EMA/SMA to confirm trend direction. Using the Average True Range (ATR) of $157, he outlines a bullish scenario above $2,275 with a ladder of target levels ($2,297.84, $2,325, $2,359.93, $2,400, $2,425, $2,450, $2,460.53) and notes the significance of $1,250 price increments for explosive moves. Conversely, he defines a bearish zone below $2,225, listing support levels at $2,214.58, $2,199.66, $2,185.75, $2,174, $2,169.84, $2,154.92, $2,140.01, and $2,135.15, anchored to SMA/EMA and post‑market activity. The overall takeaway is a rule‑based entry strategy: wait for price to tag a print, break above it, and then manage risk using the identified targets and support zones.
Chapters
Similar situation here. These are smaller prints. It's also a $2,000 stock. So going back here, May 26th, you can see we had a print. We we moved up. Then we came back to test the print. We got some more prints, and then moving up. This is a great swing entry as well. You've got increasing volume, little to no wick on top, and then this continued. We consolidated a bit here. Got some more prints on the top. You can see that was two prints there. Moved up, pulled back to the 4 exponential moving average on the daily. Same scenario. That's a great swing entry as well on Thursday. Look at this volume. And then now we're moving up. So we are going to be bullish above $2,275. So we're going to be bullish above this right here. Target $2,297.84, $2,325. $2,359.93. Up here, $2,400, $2,425, $2,450, $2,460.53 is R3. Look at the ATR on this, $157. So we're halfway to there already. And so if it's going to be an explosive move, we're doing the $25 increments, so mind the $1,250 levels as well. On this because it moves so high, and 1250. Remember, that's an eighth of a hundred rather than an eighth of a dollar. And so okay, we're going to be bearish below two twenty two hundred and twenty five dollars. Let's get just below here, below this one here. Then we've got twenty two fourteen fifty eight, twenty one ninety nine sixty six, twenty one eighty five. 75 and 74. This is just over 300,000 here, and you can see post-market came back, tagged it, pulled back to the 50 simple moving average and moved up. So this will be support as well. That's the recent low and post-market support. 2169.84, 2154.92, and then 2140.01 and 2135.15. That's the 200 exponential, 200 simple double pivot And cam. So if we pull back here and then similar thing, if we tag the print and start moving up, then that's a good entry point. You can see this as an example, comes back, tags the print, moves up, and when you start breaking above, then game on there.