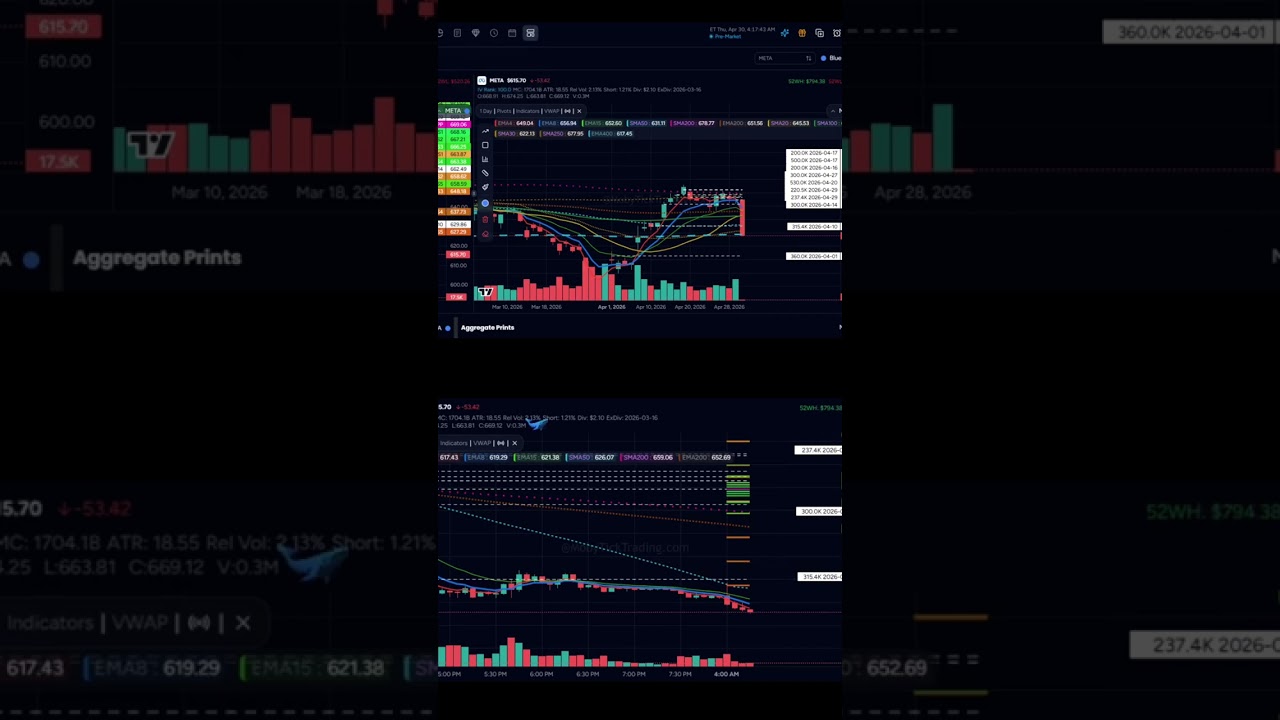
Dave Barnhart breaks down Meta's earnings-driven crash and Google's rally on April 30, 2026, mapping support and resistance levels for both stocks. Meta shows bearish entry points and target levels using moving averages and ATR, while Google displays bullish volume patterns and accumulation. Barnhart stresses risk management with stop-loss zones ahead of major economic data.
Chapters
Good morning, traders. It's Thursday, April 30th at 4:15 a.m. All right, economic news today all at 8:30. We got some GDP numbers and PCE numbers and personal income and spending all at 8:30. A little bit of volatility, but earnings season is kicking off. So we've got Meta, which absolutely died on earnings, and we've got Google that took off. So earnings is really fun to trade. You get some volatility, make some money. Let's go ahead and have a look. So we will go ahead and switch to Meta first. And here Meta actually really, really died. So, well, look at this here. Going back to 30 days, we see this coming back here April 1st. We pulled back and we started moving up. Looks like they added to their position here. Then we had this consolidation here for a while. Look at all of these prints. 200K, 500K, 200K, and we were all stuck in between my 200 simple, 200 exponential on the, on the daily chart. But we had this print, we came back to the prints, pushed off this print weaker, massive doji there stuck in the prints, and then boom, we came all the way down. We're tagging this 400 simple moving average, we're below this, this entry here, so we can have a target down here to about 585, which is back to where this actually started. There's that. There's— let's go ahead and map this one out. So we're going to be bullish above 622.50, target 625, 627.29 is this S5, and we've got 630, 632.50, then we've got 635 and 637.73 is S4. That's getting us back up to here. That's giving us another like 15, 16 points. This Moves 18.55 usually on a day. If this is— if this continues strong like this with the 4 and 8 exponential moving average, then yeah, you can continue. We might get up to 640 or 648 potentially. Right now it's quite weak. It looks like it's continuing to sell off, but we'll see. We're going to be— oh, it's already went through my bearish below. I had mapped this out here. It was bearish below 617. Let's go ahead and be bearish below 615, right? So that would have been my first target. So we'll go 615, target 612.50, 610, 605, 600, and then we've got this 360K down here at 585.26. So see how the 4 and the 8 exponential moving average are running together? If this continues, yeah, just stay in it, but mind the $5 and $10 levels as well on that on the downside. Okay, let's go ahead and look at Google, which is the complete opposite of this here. Let's look back and you can see this ladder of adding to their position here. If we come back here April 1st, look at all of these prints: $700K, $1 million, $2.5 million, $1.2 million. This is billions and billions of dollars. So we can see here we came, we came down to my 200 simple moving average here, and this is like a really nice 3-line strike increasing volume. That's a great swing entry here if anybody was watching then. Look at this. Look at this volume here. And if we went back, I'm sure there's other prints if we went back a little bit further. But this one moved up, consolidated for a couple days while they grabbed another couple million in prints. You can see that this one's moving higher as well, added to their position here over a couple days, over these 1-2 days here in these little dojis. 4 and the 8 riding together. This one gapped up, came back to the 4 exponential moving average, moved up Pulled back a little bit, more prints, and then a couple days before earnings we got more prints here, and then we're off to the races. So you can see this prints adding, adding, and then you have a little bit of a test taking off. Okay, so, so we're going to be bullish above $373.50. Let's get above this R3 target, $375, $377.50. Then we've got 380, 384.74 is our 4, 386.25. Then I've got 387.50 and 390 on that. So that's giving us, you know, 17 points. That's double the ATR on that one. This one is quite strong. We're snaggled on my 50 simple moving average right here. We're going to be bearish below 371. Let's get below here. Target 370, 368. $366.25, $365, $361.71 is a double pivot and cam. So $361.56 and $361.71, that's about 20 cents there, but that's a double pivot and cam there. Then we've got $360 if that actually occurs, which would be very close to this 200 exponential moving average here on the retracement. Okay, there you have it. Those are your two trade setups for today. So please like, share, subscribe, do all of that great stuff, and we'll see you tomorrow with all new trade setups. Happy trading, everyone. Mobitick has partnered with TrendSpider to bring real-time institutional trades to your charts. Click the link in the description below for more details.