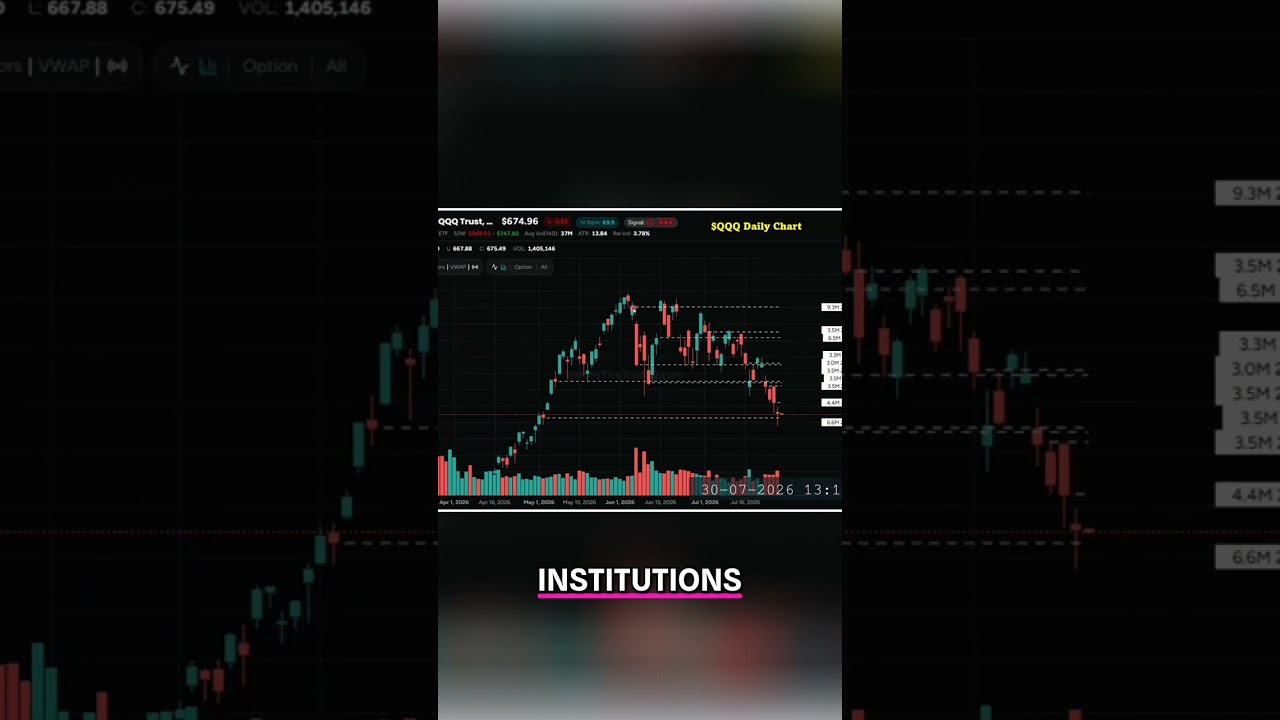
Dave Barnhart breaks down why tech stocks have crashed since June, using a $700-plus stock to show how massive institutional trades create hidden support and resistance zones. He maps out swing-trading criteria to spot opportunities in beaten-down tech.
Chapters
Any of you that have been following technology, everybody knows that it's been getting hugely beaten down recently. But look at this. This is a $700 stock here at $740, June 5th, 9.3 million shares right here on this. And what, what actually happened? Well, we pulled back. Look at the, look at the prices here. June, May, June, July, things like that. Um, we're looking at the Q's, and so anybody who's been trading technology knows that it's been an absolute disaster since the beginning of June, right? Because we were on a really nice upthrust, and then all of a sudden, look at the range that we've had from 740 all the way down here to 690. So that's a 50-point move. But when we overlay where the institutions actually have their trades, then you can see this 9.3 million, and then there was another one here a few days later around 705. That's 35 points. And then we hold here at the bottom, back up to the top, and it looks like, well, maybe they're pushing that back up to sell more. You can sell it Buy it, sell it, buy it. And so with these, you can see examples of it opening, coming down, testing a level, pushing up. So these, these are important here, and this is the hidden support and resistance. And these are as good— and these trades here are good as long as we respect the price level when we come close to it. So yesterday we had a low of what, $668 or something? But this was an old print, 6.6 million. This— we hit 670, yeah, 668, 670 level, but we respected this price level here, 6.6 million from May 5th. You can see that right down here, which would have been this little, uh, hammer right here. We came back, double bottom, and there was a 6 million share trade right there. So, and here's the Q's intraday. These are all 15-minute Candles and three million, three mil. Now these are billions of dollars, right? Six hundred ninety-two times a million is six hundred and ninety-two million dollars times three. We're at like two point four billion dollars each one of these, and you can see how these are support and resistance, and it's a distribution pattern that looks like we rallied this morning. That's what we're going to do is we're going to define some criteria. I'm going to share with you how. What I do for swing trading. Then we're going to find some things to swing trade. We'll see if we can— I've picked out 3 things to share with you, uh, but we'll see if we can find 1 or 2 more, and then maybe you might have 5 things to, uh, to look at.