FFERM Technologies Risk Intelligence Platform Demo
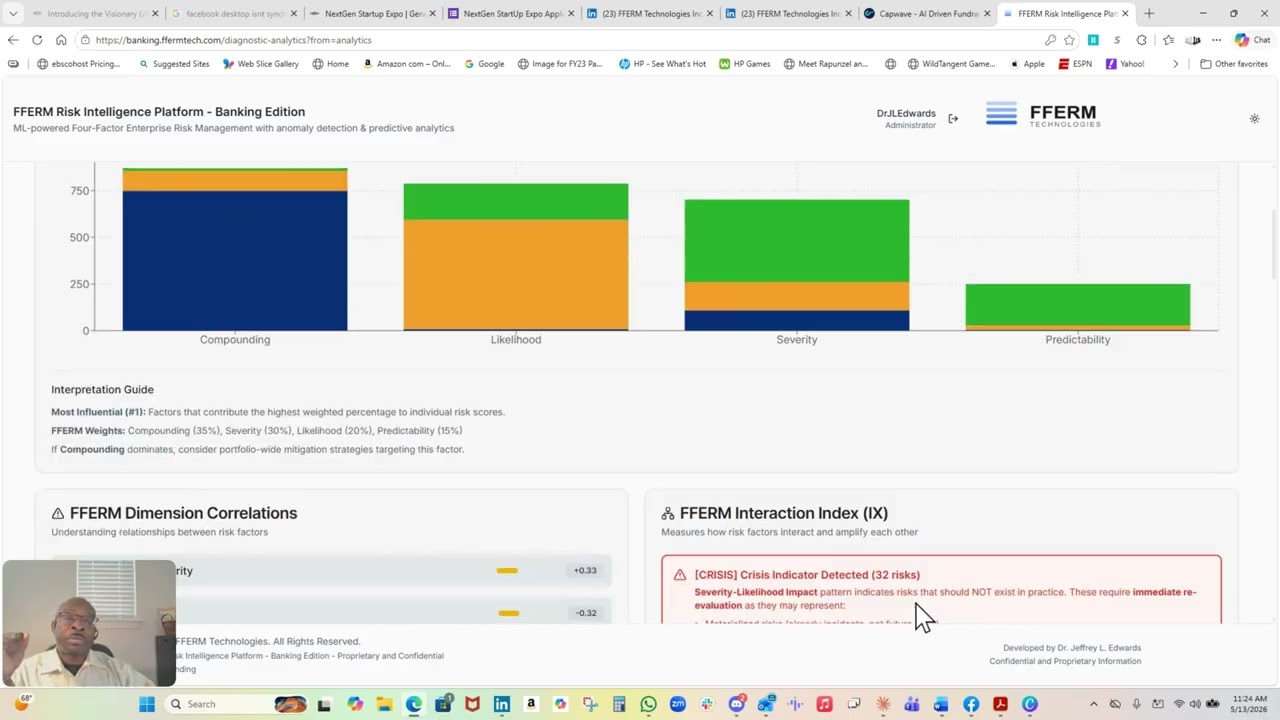
Dr. Jeffrey Edwards demos FFERM's Risk Intelligence Platform, which uses a 4-factor methodology (Compounding, Severity, Likelihood, Predictability) to quantify risks through the Firm Risk Index. The platform layers analytics from descriptive to prescriptive, includes an AI Risk Advisor powered by ChatGPT 5.0, and feeds macro-economic signals into risk scores for operational, cyber, and compliance domains.
Chapters
Hello, my name is Dr. Jeffrey Edwards, and I'm here to show you FIRM, the Risk Intelligence Platform. And what FIRM is, is it's a platform that focuses on assisting organizations implement my 4-factor methodology. The 4-factor risk methodology is a patent-pending methodology that focuses on 4 specific factors of risk converting the ability to look at the score and now look at the risk as a behavior and not necessarily just the score like likelihood and severity would. So let's get into it. First, what we will do is we will take a look at the platform itself. This is the desktop or the, the UI of the platform. Uh, we will go first into risk analytics and show you a few things in risk analytics. Um, so risk analytics is the foundation for data analytics or risk analytics from a, from a risk and data perspective. You can see that there are 4 specific types of analytics here. You have descriptive analytics, diagnostic analytics, a predictive analytics, and a prescriptive analytics. These tell a story, and the story that it tells is based off of what the purpose of the analytics is for. So with descriptive analytics, it tells you what happened. With diagnostic analytics, it goes further and tells you not only, um, what happened, but why did it happen. So you have a situation of what happened and then why did it happen. Going further to predict what could happen continuously if this situation continued. And then finally, you have a situation of prescriptive analytics or understanding what you're going to do now that these activities have occurred. Basically, your response to the events that have occurred. So let's take a look at some of the descriptive analytics, and what it does is it gives you information about what happened from an analytics perspective. So as you can see, we have some high-level information. One of those is the number of risks that's in the risk register and breaking those risks down into high, medium, low, and critical. We have 123 high-risk items, and that's 14% of the population requiring immediate attention. So that's kind of an important factor to have, to understand. Now also, we have links to many of the different components within the system. So if you see this little hand, it'll, it'll mean that you have a link or an underlying pop-up or an underlying data that you can go to. And so if I go here and see this hand, I can select it. And it takes me to the risk register, but not only the risk register, it takes me to those 100 or so risks that were identified as high. And as you can see, the level here is high. And if we go down, we should see the 190 or so risks that were there. We can't see it right now for the little number right here and my little face, but Trust me, it is 100 or so risks because it's 50 a page. So you can kind of get an understanding of how many is there. And so I will go back now and I will look at the distribution of the risks. From a category perspective, not only do we have the count, but we have the inherent and the residual. So if we look at the inherent risk, how it's actually distributed in the pie chart, and then we look at the residual risk, how it's distributed as well, gives you an understanding of the distribution of the risk as a categorical perspective. You also have risks in more of a heat map perspective And that heat map gives you an understanding of the concentration of risk within a certain area. So concentration risk for a specific area is important to know because sometimes that may indicate some type of anomaly or some type of issue that may be existing within the platform, specifically manifested through the data. So you will have very low, low, moderate, high, and very high. And as you can see, 498 of the risks are very low in the operational risk area. As we go further, we see that there's some risk reduction going on, some risk reduction metrics. The inherent risk is 262. That's the FRI, which is the Firm Risk Index score, which is the composite risk score that's created when you put together likelihood Compounding, severity, and predictability. And those are the 4 factors that go into the FIRM methodology. Again, that is compounding, severity, likelihood, and predictability. And you've probably heard of likelihood and severity because that's what the traditional risk management methodology implements today. And as you can see, more information, more descriptive information And descriptive analytics does just what it says. It describes the data. So we're describing the data in different formats and different visual ways so that you can get more information about the data than just reading a paragraph about the data. As we move forward, we get more information about the different data components. And then we can go to our next diagnostic data. And the diagnostic data tells you why. So why did we get those risks? Well, we got those risks because most of them are compounding. So that means that in the risk factors, my 2 risks that I've added to the 2 factors that were preexisting, like that would've been likelihood and severity, I added compounding and I added predictability. Compounding from the perspective of risk contagion or risk correlation, or the fact that risk amplifies and impacts each other over a period of time. And that can give you an understanding of the systemic impact of the risk, or if the risk is systemic. You also have an understanding of predictability. Now, predictability and likelihood sometimes get a little mixed up, uh, with people because they kind of use the word synonymously. Uh, in risk management, they are not synonymous. Um, in the likelihood perspective, you can look at it 2 ways. You can look at the probability of occurrence, or you can look at the frequency for which that item occurred in the past. Now, frequency can be converted into a probability or a percentage, which then kind of correlates to that understanding of if it could happen or the probability of it happening. So that's how you get to those 2 numbers and how they're related to each other. But predictability focuses on the ability to forecast. So given a situation, can you forecast the coming or the event of when it may be happening? And forecasting in this situation depends on indicators, specifically the indicators that kind of forego Or foresee the different events that may happen. And so you will look at leading indicators that will give you an understanding of what could be happening. Now, it's not going to tell you if it is going to happen or when it's going to happen, but it's going to give you an indication that it could be happening or it's on the horizon. And usually those events, the events that are high severity and high Compounding, but low predictability tend to be defined as black swan events. And as you can see, more information about the why, uh, there's some interaction analysis here, basically giving you an understanding of how the risks are interacting, being those 4 factors that I talked about: compounding, severity, likelihood, and the predictability. Well, those in fact impact each other. They influence each other. They make each other greater, stronger, faster, or slower and less impactful. So there is an analysis that you have to do to make sure that you understand the influences that these risks have on each other. And these are the behaviors that we talked about earlier in translating the numeric data to behaviors. And talking about the behaviors and not the numeric data, because the numeric data is important, but it's not the center of our conversation. We don't speak in numbers; we speak in words, and therefore we need the words to describe and get us to understand the risks and the impacts of those risks. And so one of the things that you can also look at is the risk. How do we treat risk? So that pretty much gives you an understanding of when you have a risk event, what do you do in response to that event? How do you treat that event? Many times we can accept the event, and if we accept the risk associated with that event, traditionally we would quantify the the the impact of that risk, how we're accepting it. the severity, and also compounding and predictability around that risk to make sure we know all the attributes of it. And if it was to transpire, would it impact us in a great deal? Also, we have our area around enhancing risk or exploiting risk. We can mitigate risk and we can avoid risk. And if we avoid risk, we're getting out of the business or we're leaving it altogether. If we mitigate risk, we are reducing the risk. And this is by far probably the most implementation of treatments that we have. This is representative of many organizations where the count is where you concentrate your focus on. So we can see that there's a lot of reduction or mitigation practices in treating risk. Followed by some acceptance, and then followed by exploit. And of course, the closing— the avoiding also is pretty small compared to everything else because it's hard to truly avoid risk. You can reduce it, you can mitigate it, you can transfer it, but you cannot necessarily get rid of it. And we also have transfer of risk as well. And so when we have these risks, we can give an understanding of how they impact each other and what they do to really focus on how you read, understand, and know what to do in these risk events. Finally, we have root cause, and the root cause analysis looks at the dimensions as well as the categories of risk. The dimensions being the factors, so we can look at the factors that are most prevalent. We have high compounding with high severity, and then we have low predictability scenarios. So the root cause of our situations are the fact that we have risks that are compounding and severe, meaning that they are systemically impactful. So systemic coming from compounding and impactful coming from high impact or high severity. So we have a risk that is systemically high impact. And so that is a situation because the risk is growing. And also the situation of low predictability. The risk is growing and we can't predict it in a good way, or we don't have leading indicators to give us an understanding of when this risk may occur. Finally, the category is operational risk. So we can look at how the risks are categorized within the operational risk category. And these are cascading impacts associated with risk, how the risk cascades over a period And the risk events that are occurring to make that happen. So each of these are risk events that happen in different areas of the organization. So, um, we got an understanding of the diagnostic and the descriptive. I'm going to skip predictive and prescriptive. To go into a slightly different area, but we have a good understanding of what the predictive and the prescriptive are. I'll give a quick view. We are predicting different actions in different scenarios. And then finally, we're giving risk treatments for how we respond and also giving a plan of action on what we should do, how we should do it. In response to the risks that we've identified, as well as the costing factor and return on investment associated with the risk treatments that we've identified. Now, this platform can be used by multiple different constituencies. Traditionally, you'll have more of your time spent with engineers, and, and the engineers and the analysts that are working on a day-to-day basis to manage the risk. But you also have our executives, our executive board of directors, our executive board of advisors that also need some information. And they traditionally need high-level information, not the detailed information. So what we have here is we have an executive dashboard with executive KPIs, industry benchmarks, and governance maturity around the maturity of the organization's risk management implementation. But what we'll do first is go into the dashboard. And in looking at the dashboard, you'll see that each of these components is a subsystem that was on our dashboard. So it gives us a high-level overview on the left of the health of it. And then on the right, I mean, on the— The right and the left. You go to the left here and you see the details. You can expand on the details on each of these subsystems. That gives you a pretty good understanding of what's going on, what's happening with these different areas. And then finally, if you wanted to know high level what's going on, we have 870 risks in Zone 4, and we'll talk about Zone 4 later. And we have 205 treatments with 4% under control, which actually is, you know, a bit concerning. So you would, you know, you look at this and say it does need attention and it is going up in direction. But let's say that you didn't want to read all of that information, that it was a little too much for you. We have what's called an AI Risk Advisor. Which is a ChatGPT 5.0 module that helps us to coalesce and get our risks in order. And what we'll do is we will generate a quick report that the AI Risk Advisor will look at and basically generate and review it and then present it to us. as recommendations. And so those recommendations are recommendations that it basically saw from the system itself. It has access to all of the data in the system, all the backend, frontends, and also some external links to give it a capability to pull data if it needs to externally. And so what we'll do is we'll wait for a moment to see what we get. And so, uh, it tells me that, uh, first it greets me. Dear Dr. Jeffrey, as a balanced risk leader, your expertise in steering the organization through complex risk is critical to achieving its strategic objective. Your organization exhibits a moderately strong risk management posture with a declining overall risk trend, which demonstrates progress. However, key risk violations in compliance, liquidity, and technology and cyber risk require immediate attention to align risk levels with your balance profile and regulatory expectations. So it gives you an overview of you and what it, what it knows about you and your perspective on risk. Then it gives you an understanding of the warnings that you have, gives you key insights, and then it gives you strong recommendations on things that you may need to do. So we'll go through these pretty quickly. We have the warnings, we have the key insights, you know, compliance insights, we have cybersecurity insights, liquidity insights, and strategic and credit insights, no different than what it And then it goes into detail about each of the different areas: compliance and regulatory risk, technology and cyber risk. It tells you the situation, it tells you the rationale, it tells you the expectation associated with the impact of resolving this if you implement some of these items that it's actually telling you to do. And then a timeline that you can be accomplished then. And the same for the technology and cybersecurity risk, same for the liquidity and also the strategic risk. And then finally, the low risk, uh, credit risk, the medium risk, sorry, credit risk. But if you didn't want to go through all of that, still, um, you could have at the top Told it that you wanted to ask a question, and it had a panel there. But it also has a panel here to for you to just go in and ask a question. And so what I'll ask is, I don't know. Okay, let's do a quick summary. Can you summarize? The risks. Let's see outside stuff and correlate the risks to CFRs in the regulatory space. And for those of you who are not familiar with CFRs, they are Code of Federal Regulations. And they are used to basically create all of the banking regulations that are out there. CFR stands for Code of Federal Regulation, and it has a link to the eCFR. So let's see what it does, and let's hope it doesn't make me look dumb. Let's see what happens. This is my first time actually doing this, so I hope it does connect to the CFR. Otherwise, I'll be looking a little— wow, actually, I just have to Um, so we'll see. Uh, and it's thinking, thinking, thinking, and what it's doing is analyzing what, what, what's in the system and then probably going out looking at CFR and then relating the CFRs to the specific system components. Let's see what it says. Certainly, Dr. Jeffrey or Dr. Edwards, here's a summary of your organization's current risk environment with an emphasis on regulatory concerns. And correlations to the Code of Federal Regulation. All right. Oh, and then it gives us the risk score as well. So your organization has a diversified risk portfolio with particular challenge aligned in high severity categories such as liquidity risk, gives the score, strategic risk score, technology and cyber risk score, and compliance risk score. These categories are exceeding the defined risk tolerances thresholds, yada yada yada. Da da da da da da da da da. So now what it does is actually going to go and look at. So it's giving me a risk summary, and then it's going to go to each risk and give a CFR for it. So liquidity risk is CFR 12, which is banking. 12 CFR 30 CFR Part 30. That's safety and soundness, and it's going to kind of give us some information about that. And it doesn't just specifically focus on banking regulations. Any regulation that it feels might be applicable could be in play here. And so it focuses on Food and Drug Administration regulations on sterility and CGMPs, which could be applicable, as well as SEC's focus on investment advisors. So you can see that some of this is financial and some of it is regulatory in general. So, you know, you have to actually take a look at some of those too because those companies, those regulators can have cross-functional activities going on. And so it also gives you recommendations looking at the FFIEC handbook, looking at CAMELS, A&L, doing a mapping back to CFR obligations. And so forth. So, and finally, we will quickly go over the market watch. And so market watch gives you an understanding of the macro signals and macroeconomic signals and other outside entities that will update the internal score to give you a. Combined score. So these are the macro signals. You can go and look at those signals. For this company, I'm doing P&C, so it's going to focus on that company and pull that data, as you can see. And then it will focus on each of these classes, and then finally it'll give you a Overall analysis of the portfolio fry and the macro-enabled fry, which basically is the macro-enabled piece of the the risk score. And as you can see, it gives you many summary activities associated with this component. And that's it. For now, I will go over more later in another recording, but I hope you enjoyed what you've seen, and I look forward to doing another recording for you. Thank you.
More from Dr.

Who truly holds the responsibility for Bank of America? 🤔💼 #Accountability #Finance
What will banks do after Bank of America’s secrets are revealed? 💀🤔 #Banking #Finance