Machine learning approaches in genomics
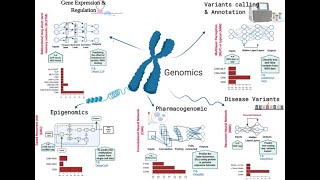
Jian Peng described protein structure prediction using deep learning and co-evolution models. Sarah Matheson presented PGGAN, which simulates population genetics data from SNP matrices. Christina Leslie introduced GraphReg, a graph neural network that predicts gene expression by combining 3D chromatin contacts with epigenomic features.
Chapters
Hi, everybody. This is Trey Ideker back with you again from UC San Diego. I'll be one of your two co-moderators for this official session 1 on algorithm development and machine learning approaches in genomics. And my co-chair—
Hi, how you doing? This is Anthony Philippakis from the Broad Institute, dialing in here from my attic in Harvard Square. This is a very exciting session coming up. We have a great lineup of speakers, and Trey and I are very excited to be able to be here for it.
Great. Thanks a lot, Anthony. And so without further ado, let's go ahead and introduce the first speaker. First speaker today is Dr. Zhenpeng Peng. He hails from the University of Illinois Urbana-Champaign. He is an associate professor of computer science, and the title of his talk is Machine Learning Algorithms for Structural and Functional Genomics.
Hi everyone, my name is Jian Peng. I'm currently an associate professor of computer science and medicine at the University of Illinois. Thanks so much for the invitation, and I would like to share some of our research on structural biology and functional genomics, mainly from a machine learning perspective. So as we all know, a protein is composed of a sequence of amino acids. When, and when the protein is presented in the, in the, in the solution, in the living cell, it has to be folded into a particular structure. We call this native structure. And the problem of getting to know how the— after the protein is generated, how to get folded into the right structure, the problem is called protein folding. And we have been studying this protein folding problem for decades. And, and why this protein folding problem is important, why do we need to understand the structure? Well, We all know that structure provides a lot of insights on the particular location, particular sites, and some, for example, there's here actually one example that is, this is a protein, one of my favorite proteins called protein kinase. What it does is to modify other proteins by adding a phosphate group. And this procedure is called protein phosphorylation. And this procedure is original. We have no idea how this is done. And only after the structure is solved, we get to know, okay, there's two— this structure has two lobes, okay, two lobes, and in between there is a pocket where we host the molecule called ATP, which is one of the most important energy molecules and also carries the phosphate group that is needed to be transferred into the substrate, which is a peptide or a fragment of another protein. And after this procedure, the phosphate is transferred to some of the residues on the substrate and thus perform a molecular switch function and turn on and off another protein's function. Okay, so structure basically provides a lot of insights on the, on the function. So therefore, the protein structure prediction is still one of the— is still a very important task. It still maintains, remains one of the most challenging problems in computational biology. So the task of the protein structure prediction And also sometimes people also call this a generalized version of protein folding, is that we're given an input sequence, amino acid sequence, and through whatever fancy computational approach you want to get, it's a three-dimensional structure on the right side. Okay, and there are a lot of very successful prediction algorithms including Rosetta, RAPTOR-X, ATASA, and the newest version of AlphaFold. And I also show you here this progress of these different prediction power collectively in the field across through the past few years. And here I— what I use is a metric that is used in the recent CASP competitions where the entire community come together and evaluate their algorithms on on some new proteins, unreleased proteins, and see whether predictive structure has a certain level of accuracy. So I only showed you here the plot until 2018 because there's a huge improvement in the most recent CASP in 2020. But here what's important is that I want to highlight that in the first, for example, in the middle of this, maybe 10, 20 years or so, we don't see much improvement. Many of them improvement can be credited to the increase of the data. Okay, so we got a template, we got similar structures that we can use them to make prediction. But most recently, you can see there's huge improvement that greatly increased the performance of the structure prediction. So why is that? I just show you the two reasons I believe that to be true. One is that the machine learning is the machine learning algorithms start to become very powerful and it can leverage a lot of data that we can make a reasonable prediction. Another is that we have a paradigm shift on how we do structural prediction. Previously, most reliable approach will be the template-based, but now we're more into the regime there where we use co-evolution analysis and which rely on the contact prediction. Okay, so first I would like to to show the current status of protein structure prediction and what we have been doing in this field. And currently there are two different approaches. As I just mentioned, there are two different approaches for protein structure prediction. So we're given first step, but the first step is always the same. So we're given a protein sequence, we use sequence search algorithms to find all the homologous sequences and build this, what we call multiple sequence alignment. Okay, and traditionally the best approach, most reliable, is called template-based modeling, where we build some model, hidden mark models, or some kind of sequence profile, and we search against this database. There's a structured database called PDB, and we identify all this kind of impossible templates, and we extract the distances, pairwise distances, or geometric constraints from these templates. You can think of the naive way would be that we copy the coordinates from the templates and the put them together, blend them together. Somehow we build this backbone structure and then we add a sidechain to the structure. Okay, but this method has been very well— like, although it has— it's very reliable, but it's hit to the some bottleneck that we can— there's upper bound, we cannot further improve the performance of template-based modeling for quite a few years. And most recently This year, the new paradigm will be this, this we call contact-assisted modeling, where we rely on this information within this alignment. So we extract something like a correlation between or among these different sites, and we predict whether these two residues, two amino acids, will be spatially close, okay, according to the correlation in the alignment. This is called coevolution analysis. And also with the deep learning models, we'll be able to predict a lot of properties, a lot of constraints regarding the pairwise residue-residue interaction. For example, whether they are close by or their orientations to be meaningful. And with these constraints predicted, we can use them to optimize the backbone and obtain some really good structure, initial structure. And further, we can also add a set of chains, we perform some type of structure refinement. Okay, so, so here the core concept is based on this co-evolution. So here I show you why this is a, it's a good intuition. So basically here we have, after we build this multiple sequence alignment, look at these two columns. And if we have a way to evaluate the strength of the co-evolution of these two sides, for example, here the e EIJ. This is a term that is used to quantify the choices of these, for example, two different amino acids. And this absolute value will give us the strength of how they— whether they like to co-occur or they don't like to occur together. Okay, and this is biological meaningful. Consider, for example, consider on the right, the structure. We have these three residues, and these two, the red one and the blue one, tend to be interacting with each other. And because they are close spatial close by, and when we mutate one, substitute one residue to another amino acid, the other one would like to also be mutated or substituted accordingly. And on the other hand, the remote one, for example the orange one, will be far from them, so the choice of the orange one usually has nothing to do with the choice of those two. So this is a basic concept. So essentially we have this assumption that evolution and structure are are this constraint that should be similar to each other in terms of these residue interactions. Okay, so here's a model usually people do. Like, this is how we actually capture this kind of interaction. So the naive model people usually call this is based on the, for example, this PWM or position-specific scoring matrix. These are based on assumption that each of these location is is independent. Okay, and so here we have a different way to write this, and this is through energy-based representation. So we have the single potentials, which means that the choices of these letters on the i-th position has nothing to do with the other sides. Okay, but this pairwise-based approach actually gives us a way to learn the coupling, this co-evolution stress. Here we introduce another term that is a sum over all these pairwise potentials, which gives us the co-evolution stress. And this, this particular formulation is very well studied in machine learning, in statistical physics, and, and in high-dimensional statistics, where it has different names: Markov random fields, Ising model, or undirected graphical model. Okay, so to solve this, um, this, this, um, this model, which is that we want to learn these strengths from the data, for example, singleton potentials, power exponential, where this is mostly critical one, we need to solve some problem that are related to the maximizing the data likelihood. Which is shown here. And here there's a partition function which makes the problem computationally very hard. So there are a lot of approaches have been developed for approximation. So mean field approximation, Gaussian approximation, pseudo-likelihood approximation, they all give different versions of the evolution, co-evolution analysis. And people have shown that these are much better than the normal correlation analysis, which is for discrete variables, we call them the mutual information here. Okay, so what is mostly exciting about this is that now we have the way to show that the correlation between this size, but it's also very noisy. So what we have, my group has really changed the field, I think, changed the field and initiated this introduction of deep learning to the field, is that we leverage some of the, some of the intuition we got from natural image recognition. For example, here, this is a classic deep convolution neural network. It is very useful to help for to recognize imaging patterns. For example, these different patches, we can organize this different patch in a hierarchical way to give some output. Okay, and, and here we also treat this protein like, for example, co-evolution data evolution, we also call evolutional couplings, as image. Okay, we also look at the local patterns in this evolution coupling matrix, and we apply this hierarchical deep learning model to put in— put all this signal together in a hierarchical manner and then predict the distance contact map. Okay, this can be binary, which means that whether they're close by, these residues are close by in space, or we can just predict the distance. Okay, and, and this is our model. So we, we build this model, we learn from the co-evolution. You can see these are very noisy signal. Okay, and then we go through all this, this hierarchy. This is a, this is a hierarchical neural network, a deep convolution neural network, integrate all kinds of features. And on the bottom, you can see that we basically, this model denoise the original, the co-evolution patterns. And also generally, the contact map looks very similar to the actual contact structure. Okay, so here is another example. This is actually the distance matrix we see, okay, from the native structure. This is the program we use to generate the input for the neural network, and it looks very— you can see there's some pattern but very noisy. And this is the version after we apply the deep contact, the neural network, to the This is MPRAD. So what we got here is that we use this new— this generated— this, uh, this, the, the contact map to help fold the new structure. So we tested it in CASP12. You can see that it generates much better structure than the original input, and we were— and, and, and our program is also ranked among the top in CASP12 a few years ago. Okay, so why does machine learning deep learning work for, for this particular problem. So we actually perform some visualization. You can see that here we take the first layer filters and visualize into 2D, and we color them according to secondary structure. You can see that this parallel or anti— this parallel or anti-parallel patterns of beta strands are all these kind of diagonal or anti-diagonal patterns. And for helical-helical interactions, we see this kind of spaced space the patterns, which corresponds to the gap, corresponds to the space between them, corresponds to the number of residues in each turn of the alpha helical. So, so this corresponds— this visualization shows that within deep neural network actually learns something that is meaningful. And at a higher layer, these patterns are organized into higher, like, the more complex structure motifs for structure prediction. So Okay, after this, many groups have developed different approaches, like RaptorX, AlphaFold, and Rosetta. They are all based on the similar intuition, building the— extracting the patterns from, from the co-evolution data and predicting the residue-residue interaction and some other angle properties like inter-residue angles. And they have been also shown to be successful. But what's mostly interesting is what happened last year, that in CASP-14, DeepMind's approach, they have some component related to the previous, what I just described, but they greatly improve the performance. Okay, you can see that the GDT, which is score between 0 and 100, 100 means perfect prediction, and AlphaFold is able to give a score close to 90, and this 90 is about the the variance between this body, the, the, the consistency between the two structures solved by the two different groups. Okay, so here I also show you down there, they are very challenging two structures. I tried all different approaches and existing algorithms, and these are the structures from SARS-CoV-2 virus, and all existing structure prediction algorithms cannot make any reasonable prediction for these two. Basically we just got a random prediction, but AlphaFold 2 is able to generate a prediction that looks almost perfect, okay, so which I think is very impressive, okay. So in the rest of this talk, I'll be, uh, move a little bit away from structure prediction but focus on the function prediction. So beyond the structure prediction, what we really wanted to know, like you understand, is actually the protein function. That is, we're given a protein structure or sequence, we want to understand its function. It has a lot of applications. For example, we can use it to improve— if we have such a model, we can use it to improve binding affinity of antibodies, optimize fluorescent proteins, or even improve the specificity of gene editing. Okay, so what do we need to be able to have such a model from a machine learning perspective? So essentially, we want a model that takes a sequence as input and gives an output which is a function value. Okay, so the model that is useful for function prediction has some needs, some, some— there should be some requirements. For example, we need the model to be sensitive enough to differentiate the function level of very similar sequences. Okay, because sometimes we know introducing important residue will completely change the function. And we also need to model the non-additive effect, epistasis, and interact changes of these different residues may have interactions. And we also need this model to be good enough to generalize to unseen sequences and mutations. Okay, so my group has developed quite a few different machine learning-based approaches for modeling this, for modeling the protein function from sequence. For example, we have this recurrent neural network versions. We also have the model that takes both the protein sequence and the and the substrates as input using the convolution neural networks. And we also have applied this different approach to different applications, including phosphorylation, protein RNA binding, and protein drug binding. Okay, so all of these different applications requires a lot of data to train the model. Okay, so, but in practice, we don't have a lot of data. The label data expensive to get. So there are quite, there has been a lot of ideas in the machine learning community we can borrow that can be applied here. So one idea is that we can use unsupervised learning to learn good representations using language models. Okay, so these data are very easy to obtain. We don't have labels, but they present some kind of a good representation of the protein or the sequences. Okay, so basically the idea is that we have the sum of the sequence of the residues we have seen, amino acid we have seen, we want to predict what we will see next.. And there are other models like transformer models, which is more complex but is also able to learn to make such predictions. So these approaches can be trained— these models, large models, can be trained on the PFAM or UniProt with a lot of sequence but without any labels related to their function. Okay, but the drawback of these approaches are too general. Maybe they will just capture secondary structure, solvent accessibility, some of this basic grammar offer this protein sequence, but we're not specific enough to reflect what the special function we want to study. Okay, another idea we take is, uh, is from— is similar to what I have had before, is that we can learn from evolution. So here we can build the sequence alignment, and we assume that all these sequences have some native function, and they have all passed the selection step during evolution. So we can treat those as weakly labeled data. We know they have survived through the evolution. We know the they can be treated as positive data somehow. And these data are not a lot, right? We know that there are not a lot of data to train very complex deep learning models, but they are good enough to extract good features. So what we have done is that one thing we— first thing we did is that we can check whether this kind of evolution patterns actually correlates with function. So on the left, we have some experiment data from deep mutational scanning, like pairwise deep mutational scanning. And on the right, we have this model we have shown you before to compute the co-evolution pattern, and we actually check whether they correlated. And, you know, different sites, you have different correlations, but on average, if we have a lot of homologous sequences in the alignment, we tend to have stronger correlation. Okay, so this gives us some insight that we can actually use co-evolution patterns to form features. Okay, so this is our model. We call this ECNet by integrating evolutionary context, global context, and local context for structure, for protein function prediction. So on the top, we use a global model, language model, to extract the sequence representations. And also on the local, we have this model that it learned from multiple sequences. Those are homologous sequences, very similar sequences, close sequences, and we use them to learn these specific and these the features that are sensitive to mutations. And then we use our favorite model to integrate all these features together and so that to predict the protein function. So we have evaluated this on a large collection of deep mutation scanning data. These are single mutation datasets, and we perform rigorous cross-validation and show that it works much better than the previous unsupervised versions, such as the EVFold or DeepSequence, and also better than the supervised model that is based, developed by the machine learning community. Okay, so we have also tested the generalization of this model to high-order mutations, and you can see that on the left we tested on the GFP, and seems like with a single and a double mutation, we'll be able to predict the very high-order mutation, which means that maybe the pairwise, the high-order interactions may not be that important. The pairwise might be good enough. And on the right, we also tested the— collect the literature data on these resistant TEM. This is beta-lactamase and show that our model is able to differentiate these antibiotic-resistant alleles against the random alleles. So finally, we apply this to actually engineer the inhibitor-resistant beta-lactamase. So we take the structure, the sequence structure. We use our ECNet to design a collection of mutants with high-order mutations. And we check whether they are resistant to a very important antibiotic compound, ampicillin. And we tested it across different concentrations. And we have here— I also show there— here we have two different models. And we also have the positive controls. There are very, very handful of positive controls in the literature. We collect only we examine all the literature, only collect a very few number of them, which means that this is a very hard to engineer protein. And we did the— we replicate this experiment multiple times and show that actually our hit rate is really pretty good when the concentration is high. Okay, so finally, I would like to thank the audience. Thank you all. And also thank my students and my collaborators and all the funding agencies.
Thank you very much.
Okay, thank you so much. Yeah, so the way this is going to work in, in the sessions is we'll have a very brief Q&A after each talk, and then we'll have a lot of time at the end of the session. We'll have 30 minutes at the end to, to have a broader discussion. So just quickly, let me, uh, ask one question, um, from, from the audience. How did you decide the size of the images in the co-evolution, presumably as input to the convolutional neural networks you talked about? Would different image sizes cause learning of different relationships between correlated patterns?
Right, to prepare the input, we first compute the evolution of couplings and summarize those values for each pair of positions. So essentially, if you have a protein with length L, you've got L by L matrix of inputs. But of course there's a lot of engineering that needs to be done. For example, because we don't have large like RAM, GPUs, we have to cut the proteins into meaningful domains. So there's a way in the current version we mainly consider the intra-domain interactions, not inter-domain interactions, and that will make the engineering much easier to do. And I know there are a lot of other groups also consider inter-domain interactions and protein-protein directions, and there are some other like kind of input needs to be prepared, and also the evolution patterns needs to be formatted in a different way. So essentially, this is in practice we mainly consider whether we can actually implement the accuracy, like run them with sufficient, with a given resource. It's not related to whether we want to It's not that we want to cut them into pieces, it's mainly an engineering consideration.
Great. Another question is, what is the success metric used for 3D structure prediction? Maybe you can say a little bit more about how it works.
Yeah, so usually the, the, the, there are quite a few different metrics people use in the field, but what they are, they're trying to, they do are pretty similar. So given predict a three-dimensional structure and a native structure, well, usually the first time, first step we will do is superimpose those two geometrical objects. There are a lot of algorithms to do that. After doing that, we just check where the deviation between the predicted residue position— usually we consider, for example, the backbone atoms, the alpha atoms— and how far that each predicted alpha atom atom is from the native atom, and then we compute, for example, like we can set a certain threshold. Let's maybe we can consider like, for example, 1 angstrom to be meaningful, 2 angstrom to be meaningful, and then we can summarize the fraction of the correctly predicted to the percentage of the corrected predicted residues. And so this is usually people do, for example, GDT score I mentioned here is computing this way with by averaging multiple thresholds. There are also some other metrics people use, for example, comparing the pairwise distance, but all of them have the similar manner. So usually people summarize that between— due to a score between 0 and 100 or 0 and 1. 1 means perfect, 0 means not meaningful.
Okay, great. So to stay on time, let's move on now to the second speaker, and again, we'll have lots of time after the session to discuss more. Excellent.
So our second speaker will be Sarah Matheson, who is an assistant professor of computer science at Haverford College.
Hello, everyone. My name is Sarah Matheson. I'm an assistant professor at Haverford College in the Department of Computer Science, and I'm very happy to be here for the machine learning in genomics workshop today. And specifically, I'm going to talk about generative adversarial networks and their use in population genetics. But more broadly, I want to give a sense of where where we're going in machine learning and population genetics, and also kind of the shifts that have happened over time in the field. So one of the big questions in population genetics is how do we go from all of this simulated data, all of the sequence data, and actually learn something about evolution? So here I have this big matrix of zeros and ones representing a bunch of different samples and a bunch of different SNPs for these samples. And say I want to learn something like recombination hotspots or something about the recombination landscape. But I don't want to do this just for these particular— this particular sample or just for this particular problem of recombination. I want to do this more generally in any species that I'm interested in and maybe any evolutionary phenomenon that I'm interested in as well, say heritable traits or diseases, admixture, natural selection. I don't want to have to redo the entire method every time that I change the application or change the species. And so if I were to think about what are the properties that I really want for this type of method, I would definitely want it to be fast and flexible, and maybe I would want it to be a machine learning method. So I think there's been several shifts in population genetics recently, and one of them was toward machine learning in around kind of 2010 timeframe, and then a second shift that started to move away from summary statistics. And then I'll talk a little bit about one of my ongoing projects in my lab about using generative adversarial networks and adversarial training more generally to create simulated data. So what about this first shift toward machine learning? So I think one of the papers that really highlights this nicely was in 2013, this paper that was trying to identify regions as either neutral or under natural selection. So binary classification problem. And one of the observations which has been known for a long time is that selection distorts properties of genomic data. And in particular, this is highlighted in the site frequency spectrum, which is a common summary statistic. And so in these figures, the blue line here shows a neutral region and what the site frequency spectrum would look like. And these red curves show what it would look like under natural selection in a variety of different scenarios. So could machine learning, which is known to be good at pattern detection and highlighting and picking out subtle signals, could it be used to actually detect natural selection? And so the authors showed that it could, and their method that they used was a more classical machine learning method of the support vector machine. And broadly how this works is that neutral regions are simulated, in this case of natural selection, shown in red here, and then regions under selection shown in blue here are simulated as well. And the idea of this model is to try to identify some boundary or some barrier between these two different types of regions. And if we're able to fit that boundary very well, then if a new dataset comes along, say a real region that we're trying to see if it's under selection or not, then we can plot it in the statistic space and actually see which side of the boundary it's on. So in this case, we would probably identify this region of real data as predicted as under selection. I think this is a really nice example of how machine learning had started to be used because it was very good at finding signals from summary statistics. But the issue arises in the case when we don't really know what summary statistics are good, or maybe we have a lot of summary statistics available. Here are a bunch of common ones I used for a project around 2016, and we don't really know if we change our problem of interest, do we need to change our summary statistics, or do we need to invent new summary statistics? So one usage of machine learning is really to identify important features or distill down combinations of features that will be really useful useful for problem of interest. So what we decided to do was feed all of these summary statistics into a deep learning method. The deep here just means, you know, these multiple layers, and actually infer both selection and population size changes. So here represented as this simple bottleneck model, but jointly inferred along with natural selection. And the idea was that this this deep learning method could actually distill down information within these summary statistics, creating groups of summary statistics or features built out of summary statistics that would be informative for these parameters. So I think these— there was a lot of activity in machine learning around this time, but one of the drawbacks was that it still relied on these summary statistics. And so So then there was a second shift away from summary statistics toward trying to use this raw data. And part of my motivation for moving away from summary statistics was actually to not have to change them for every application and not have to think about inventing new ones for every single new problem that I'm interested in. So for this, I think several groups drew inspiration from convolutional neural networks, or CNNs.. And these have been developed in a lot of the image recognition and classification literature. And very, very broadly, one of the key ideas of CNNs is that these little filters could pick up on different aspects of these images. So say, for example, maybe this filter would learn to identify beaks or feathers, and then if those filters is sort of lit up in classification, then we might be more likely to include— conclude that this image is of a bird. So the idea was that these learned filters could be used in genetics to try to find out which aspects of the data were really informative for certain parameters of interest. However, there are a few issues in this, one being that these filters are really specialized for images, but they, they are not really specialized for genetic data. And the second issue is that for, say, an unstructured population where this— the order of the individuals is, is not really informative at all, we don't want to encode that into our network architecture. So for an image, if we imagine just sort of shuffling all of the different pixel rows of the image, it wouldn't mean anything anymore. But for genetic data, we want to say that's actually okay, that's actually the same data set. So I'll focus— there's a few methods during this time that worked on CNNs for genetics, and I'll focus on the second one where we were trying to create an architecture that would actually sort of respect some of the properties of the underlying data. So for this, we looked at our raw data as, again, a series of zeros and ones. In a matrix, but the samples or the rows are now exchangeable. And we fed this not through these square filters, but actually used filters of height 1. So these filters actually only spanned one haplotype or one sample, and thus they didn't encode any information about the ordering of the samples in this network.. And then we did that for several layers to make sure that we weren't assuming anything about the order. And then toward the end of the network, we actually collapsed along all of the rows. And so that would give us something that was also permutation invariant. So there are lots of different permutation invariant functions we could choose here. Sum, max, average are all permutation invariant. And this allowed us to kind of distill down some of the information that had been learned in the previous layers. And then finally, we can infer some evolutionary parameter that we are interested in. So this network was able to work quite well on a few different types of problems. One example is actually looking at recombination hotspots, so a binary classification of either a region inside a hotspot or not.. And we plotted over the training iterations, we plotted the accuracy. And we found that for this blue line here, this was the exchangeable architecture or the permutation invariant architecture. We were able to get higher accuracy than if we just used some of the more image-oriented CNNs shown in these other curves here. So really explicitly encoding the nature of the data was able to help us perform better in this network. So there's several different CNN methods developed during this time, and I think it was a huge step forward for the field. But one thing I've kind of glossed over is that we still need simulated data for these machine learning methods. And actually, it's very important for machine learning methods in genetics to have simulated data as the training data, since we don't really have any real examples where the evolutionary history would be known. Or in other words, we need to use supervised learning because we don't really— we need to use supervised learning and therefore we need the labels and we don't really have the labels of any real data. So we really rely heavily on that simulated data. So I became very interested in developing better simulated data. And this was inspired by several times when I tried to create realistic simulated data and gave my sort of best guess at the parameters and I still was not really able to accurately capture some of the features of the real data. So here are a few examples where the real and the simulated datasets look very different, and here as well, even when I tried to put in sort of reasonable parameters for these, for these simulation programs. And as a, as a broader point, the role of simulated data in population genetics can really not be overstated. It is useful not only for training these machine learning methods but for validating methods, developing intuition. It's extremely important. And to that effect, many different simulation programs have been developed over the years, and two of the most popular ones right now are SLIM and MS-Prime. And these, these programs work very well at recapitulating evolution, but they do require many input parameters. And so it's very— it can be very difficult to really identify what are the best ones. And here are some examples where this didn't really work. So I was interested in trying out generative approaches, and specifically generative adversarial networks. And the idea behind these GAN algorithms is that our initial guess at whatever type of simulation we're trying to come up with is probably going to be pretty poor quality, right? If we just guess, we're not going to be able to develop a really good simulation right off the bat. So to draw an analogy from the art world, say we are a forger and we're trying to make sort of fake artworks and, you know, in the style of famous artists. And so if we just try this and we were starting out, we're not very experienced and we just try this our fake data might look like this. And so now it's pretty easy for, say, an art critic to determine, well, one of these is fake and one of these is real. So say we go off and we say, okay, well, that wasn't very good, but we try to train more and we learn more about art and we try again. And maybe this time we're a little bit better. So we try this example on the left, but it still doesn't really look like a real Picasso on the right. So we go off and we train more and we learn more about art and we try again. And I'm not sure what these look like to you, but to me they look pretty realistic. But it kind of turns out that both of these are suspected to be fake Jackson Pollocks. Okay, so kind of being a bit more detailed, if we were to think about what a GAN architecture really looks like, it has these two components. It has this generator or we can think of that as a forger that's trying to create these synthetic examples. And then we have the discriminator. We can think of the art critic that's actually trying to identify this real versus fake. And an important part about the discriminator is that they have to make a binary classification at the end of the day, whether that example is real or fake. And as part of this feedback loop, based on that information, the generator tries to perform better. And so eventually both of these entities will become better over time, with the generator creating more and more realistic data. And then because of that, the discriminator has to get better too and identify these subtle differences to try and identify which are real and which are fake. So this is kind of the broad idea, and this has been used in images before, but for population genetics, there's quite a lot of modifications we need to make to really get this to work in a new system. So what we did is designed a new GAN framework for population genetics which we call PGGAN. And the idea is that we still are feeding in generated data and real data into the discriminator and training the discriminator that way. But instead of the generator going right to reconstruct to simulating all these zeros and ones, I actually wanted to include an evolutionary model as part of the generation process. So instead, the generator needs to choose these parameters of, say, an evolutionary model, say, these population sizes, N1, N2, N3 in this example, and then feed those into some evolutionary simulator and then create the generated data. And so because of this unique generator architecture, we can no longer really use backpropagation or a lot of gradient descent style approaches because we don't have the gradient anymore. So to overcome this, we actually used simulated annealing algorithm to select the parameters that we feed into the evolutionary model. And the idea here is that we start out with being able to rapidly move across the parameter space in terms of our evolutionary parameters at the beginning. And then as this temperature cools down, we're able to make more small refinements to our parameters until at the end we should hopefully have parameters that generate data that is as realistic as possible and confuses the discriminator. So this was our generator, and then for the discriminator, we chose to use a CNN. And for this CNN, we actually expanded on the permutation invariant CNN I talked about earlier. To include multiple populations. And the idea here is that we, we want to include a richer set of evolutionary models, so we need to handle multiple populations. And within each population, the samples are permutation invariant, but between populations they are not. And then after several layers of convolutional layers and filters here, then we collapse along the rows and then concatenate the two populations together.
Together.
And then instead of the output being an evolutionary parameter of interest, it's actually this binary output or probability of being real or fake. So we have this sort of binary classification problem. So before I talk about the results, I wanted to say just a little bit about what can go wrong in GAN training. GANs are notoriously difficult to train and in part because there's two optimization problems, the generator and the discriminator, and they're adversarial, so they're competing against each other. So one of the things that can go wrong is that the discriminator classifies all datasets as real. So across these training iterations on the x-axis here, if we look at the accuracy on real and fake data, the discriminator is classifying— is 100% accurate on the real data, classifying everything as real, but zero 100% accurate on the fake data. And this is also represented in the loss, where the generator loss is not very low. It can't really— it's not getting any positive feedback. It's just everything it does is classified as real, so there's no incentive for the generator to improve. So this is definitely a major thing that can go wrong. In contrast, looking at examples of successful training, we see that in the beginning, usually the discriminator is very accurate. And then it reduces its accuracy over time to around 50%. And then at the end, it's really often confused. And even though there's some back and forth, it's typically not able to really accurately determine real or simulated. And at the end, the losses are balanced, meaning that the generator and the discriminator are both really working hard to do their jobs. So one way of evaluating this type of method is to look if there are some features of the real data that are accurately being captured by the simulations. So we looked at summary statistics here as a sanity check that our method was working. And so for one example, we looked at just a single population, and here Here's CHB, which is an East Asian population. And if we just use a constant population size, then we didn't, you know, we weren't really capturing the real data very accurately, or these, these green and gray curves were not very, very close together. But if we used a more sophisticated model that actually included exponential growth and some time, time, size changes at different times, we're actually able to much better fit the data. We also looked at a two-population model of modeling the Out of Africa event with YRI and CEU, African and European population, and we're also able to really closely mirror the summary statistics here. And then we are also able to fit this model and just look at the parameters as another sort of sanity check that we were getting reasonable results. And we do see the Out of Africa model, Out of Africa bottleneck and re-expansion here in CEU, as well as some migration post-split. So this was encouraging that this was broadly in line with the existing literature. So a little bit of where we're going with machine learning. I think there's many different opportunities for PGGAN in particular, especially for studying understudied populations where we don't have a very good idea of what the default parameters would be. And then also overcoming this fundamental imbalance since we have unlimited simulated data but limited real data. And I think more broadly, we really need to keep the data in mind and not just take off-the-shelf methods from other fields but really think about what methods will be most applicable for our data and what modifications and new algorithms do we actually need for genetic data, such as this permutation of variant architectures or simulation generators that don't rely on the gradient. I think we really need machine learning methods to be more interpretable. We don't really know what these CNNs are learning yet, and I think there's a lot of opportunities to combine machine learning and evolutionary modeling. So it's not one or the the other. And finally, I would say that I think we need to think more about moving away from simulations, too, and thinking more about unsupervised learning and learning from the real data directly. And with that, I wanted to thank all my collaborators and funding, and thank you for your attention.
Thank you so much, Dr. Matheson. Wonderful talk. So I'll start with a few questions by our audience. So first, you said that you needed simulated data for training supervised models.
Are you also exploring unsupervised models? Yes, and I think that's a great question. And I think that part of where the motivation for the GAN framework came from is actually this exact idea, is that we're not just using purely simulated data that we kind of make up based on our best guess, but we actually try to use the GAN to generate better simulated data. And thus, the real data is actually fed into the GAN, and then that the simulated data tries to match that. So I think that that's kind of a hybrid approach in terms of it's not purely unsupervised, but we're trying to use the real data directly instead of at the very end after we've already trained on purely simulated data. I also think there's a few other groups in this area that are working on using unsupervised learning more directly in terms of visualization and clustering and things like that that would actually be really purely unsupervised without any training data at all. So I think there's there's much room for improvement though. I think I would definitely encourage people to kind of think about this area of unsupervised learning in population genetics.
Great. Thanks, Sarah. I'll ask this last question by Jong Yoon. For the SNPs data as input to the convolutional neural network model, they assume 0 and 1 refer to the number of minor alleles. Have you tried the 0, 1, 2 type input in your models and how to optimize the stride in the CNN model.
That's a great question. So yeah, 0 refers to the minor allele and 1 refers to the— or 0 refers to the major allele and 1 refers to the minor allele. You can also, if you know your ancestral derived state, you can have 0 as the ancestral state and 1 as the derived state. That would also work. I think if It would be interesting to try other approaches. You can also try like a -1, 1, and then 0 is for missing data, which I think could be better in cases when the quality is less good. In terms of increasing the number, I mean, usually we really see biallelic SNPs, and that's why you don't sort of see higher numbers, but I think there's no reason not to include them if that's better for your model. I think you just have to be really careful, because we're using ReLU and all these sort of different activation functions, you need to be careful about where is your 0 mark and what are you really assuming you know, you don't want everything to be positive if those are the things that are going to be sort of filtered down your network. So, you kind of have to be aware of that.
What do you think, Anthony?
Shall we do one more or shall we move on? Well, you know, there's a really good question, so maybe we'll do one more. So, what type of loss functions do you use for imbalanced data? And do you apply any upsampling for unbalanced data?
That's a really interesting question about this sort of data imbalance. For us, we try to simulate the exact number of real datasets we have. So, we kind of get around that a little bit with the balancing of the data. I think generally we use this sort of binary cross-entropy loss functions for the GANs. I can talk more about that in the main Q&A, but I think that in general, there is this fundamental data imbalance, right? We have unlimited simulated data, we have limited real data. And so I think that needs to be further explored, but it's not something I've done yet.
Okay, great. Thank you, Sarah. So let's move to the final speaker of our session 1. It's my pleasure to introduce Dr. Christina Leslie from Memorial Sloan Kettering Cancer Center.
Her talk is titled "The 3D Genome and Predictive Gene Regulatory Models." Hi, my name is Christina Leslie. I'm at Memorial Sloan Kettering Cancer Center, and I want to talk to you about using machine learning models together with 3D genomic data to train predictive models of gene regulation. All right. So as I'm sure you're aware, gene regulation involves the collaboration of transcription factors that bind at the promoter as well as at the enhancers that can be quite distal from the promoter and DNA looping that brings enhancer elements in contact with the promoter and leads to upregulation of expression of the transcript. Quite some time we've used 1D epigenomic data, information on where transcription factors are binding, information about chromatin accessibility and histone marks to map the presence of candidate enhancer elements, but we haven't used until recently the 3D connectivity of these elements. Okay, so Why do we want to try to predict gene expression? Well, gene expression is important for the function of cells and for understanding what cells do in different states. And this is information or data from one of my own papers, but there are many such studies where we're looking at chromatin states of, in this case, CD8 T cells and functional T cells and T cells that progress to dysfunction in tumors. Okay, and what we can see by looking at this chromatin accessibility at specific loci— so this is the locus that encodes PD-1 in the mouse. PD-1 is an immunotherapy target. And this is the locus of an important effector cytokine, interferon gamma. And what happens as T cells progress to a dysfunctional or exhausted state, there are chromatin accessibility changes at these loci different from when you get effector or memory functional cells, okay? And these changes somehow encode the gain of expression of PD-1 and the loss of gene expression of interferon gamma., and we'd like to understand this and model this. For NHGRI, it's also important to link genetic variation to gene expression. Okay, and this is an example that's not from my lab, it's from a recent paper trying to understand the association between genetic variation and gene expression of a particular gene, okay, BLK here, as well as doing association of genetic variation with chromatin accessibility and teasing apart how changes in the DNA sequence can change accessibility and chromatin state, and that can change gene regulation. Okay, so ideally we would like to have machine learning models that could automate this process. In my own lab, we've done a lot of work in this domain trying to use models to predict gene expression or fold change between different cell states from the sequence content and the accessibility or activity of regulatory regulatory elements. And we're doing this not to predict per se, but in order to decipher gene regulation, figure out what the regulators are, figure out how individual genes are regulated. And the missing information in our models so far has been the connectivity information, the connectivity of promoters and enhancers. So what I want to show you today is using 3D interaction data in order to model gene regulation using graph neural networks. Okay, so the data we're going to use is chromosome conformation capture data such as Hi-C. Here's a picture of Hi-C. The basic idea is that you're cross-linking proteins to DNA in situ. You do a restriction enzyme digest so that you're cutting up the chromatin. You ligate and pull down, and you get paired-end reads where the read pair maps a contact. So the pair of reads can be distal in the 1D genome, but they had to be close in the cell in the input population. And this data allows us to build a contact matrix that gives us information about 3D proximity of genomic regions. All right, and we can look at these contact matrices at different scales, at genome-wide scale or chromosome-wide, but we're more interested in these domain-level and loop-level and individual promoter-enhancer interaction level information. Okay, so if you zoom in to these maps close enough, you can see organization like topologically associated domains, and within these TADs you can see some loops between genomic loci. Okay, methods matter. So in our lab, we've developed our own statistical approaches to infer interactions, significant interactions, directly from count data. And we call this method Hi-CDC for Hi-C Direct Caller. So essentially what we're trying to do is estimate a background model from the count data using negative binomial regression. The covariates that are important are the genomic distance, as well as features of the interaction bins such as mappability, number of restriction enzyme sites, GC content. And when we fit our model, we can observe the counts and decide how surprised we are to see a high count and assign a p-value or z-score. Okay, and this latest version, Hi-CDC+, is in revision, hopefully coming out soon. And when we can do that, we can start to see interactions that are of interest to us for modeling gene regulation. So this is data from Danwei Huangfu's lab in collaboration for our 4D Nucleome project that also involves Effie Apostolou And what we're looking at is a progression of guided differentiation of human embryonic stem cells towards insulin-secreting beta cells, okay, and looking at these different stages of pancreatic differentiation, standard normalization at the top and Hi-C/DC normalization with z-scores at the bottom, and what we can see is certain 3D interactions beginning to get set up that influence the promoter of this important diabetes gene, PDX1. Okay, so we would like to understand how at different stages of differentiation this enhancer rewiring influences expression of the target gene.
Gene.
Okay, so now I'm going to get to the machine learning part and tell you about a model that we've developed called GraphReg, where we're using graph neural networks to infer gene regulatory models. Okay, and the idea is we're going to use Hi-C, or we're actually going to use a variant called Hi-ChIP, to encode 3D interactions, regulatory interactions as a graph, and we're going to propagate information along these edges in the graph via graph neural networks. Okay, so we think of the linear genome as a set of bins. The bins are connected by edges that we get from HiChIP data. The input features are going to be either 1D epigenomic data or DNA sequence, and the output is going to be gene expression. Okay, so the expression output of each bin. Okay, so we have two models: one that uses epigenome-based data and one that uses DNA sequence. So I'm going to talk about the epigenome-based graphic first. Okay, with this model, what we do is the inputs are chromatin accessibility and a minimal set of histone modifications. We actually just use one promoter mark and one enhancer activity mark. Okay, we go through a few CNN layers, and this helps us learn local features of the, of the chromatin. And then we pass through several graph attention network layers, and this allows us to pass information between enhancers and promoters. And then we predict the promoter output as measured by CAGE-seq, okay, which is a tag-based protocol that maps promoter activity, the output at specific transcription start sites. Okay, so roughly speaking, this model predicts gene expression from the activity and connectivity of regulatory elements. This model is also cell-type agnostic in the sense that if you train in one cell type, you can go to a new cell type, and as long as you have inputs, 1D and 3D inputs for the new cell type, you could predict expression there. All right, just a few more data information details on the model. We're using DNase, we're using H3K4 trimethyl and H3K4me3. K27 acetyl and a finer binning for the histone marks. But by the time we get to the graph attention network, we're at a 5-kb binning. Okay, so, and we are predicting at this bin, this resolution, the CAGE-seq. Okay, and we're making a prediction on fairly large genomic regions of about 2 megabases. Okay, how well can we do? We actually can do quite well. All right, so this is true signal versus predicted signal on how about chromosomes in mouse ES cells, and you can see a nice correlation. Also, if you train the model in different cell types and then again on how about chromosomes, try to use these models to predict fold change. Again, the fold change looks good. Here the color, the darker color means that you are looking at promoters with more HiChIP edges. Okay, so they have more complicated regulation. Okay, the other model, the sequence-based In this model, we start with 6 megabases of DNA sequence, one-hot encoded. We pass through a few CNN layers again to learn local features, so now sequence motifs. And then we pass through dilated convolutional neural network layers in the bottom path to predict accessibility in histone marks. Marks. Okay, there's another path through the model where we take the output of this CNN, these motifs, and we pass to the graph attention network and try to predict CAGE-seq. Okay, so now we're using DNA sequence together with 3D connectivity to predict both gene expression and to predict the 1D epigenomic data as an auxiliary task. Okay, this is definitely a cell-type-specific model in that you're learning sequence information that is specific to the cell type that you train in. Okay, and just again a few details on the model. The bottom path through the model is very similar to the dilated CNN model called Bissenji developed by David Kelly. Okay, so these sequence models models that have been used in regulatory genomics. The novel part is the top path that uses the graph attention network. Okay, and again, the sequence model, it's a harder task, but we can evaluate on 100 chromosomes and look at true expression versus predictive expression or fold change versus predicted fold change. And again, it's a reasonable correlation. Okay, and finally, I'm passing through this quickly, but if you compare the prediction of either the epigenome or sequence-based model to the corresponding CNN model— okay, so CNNs are widely used now in regulatory genomics. They're not incorporating 3D information, the graph reg models do better. And in particular, they are more— they give higher accuracy for prediction of gene expression when you start restricting to genes that are expressed and genes that have more complex regulation, more high ChIP edges. However, unlike in a lot of machine learning, the prediction performance per se is not the point. We're doing this because we want to understand how gene regulation works and how individual genes are regulated. We want to interpret the model. So what we can do is use feature attribution to predict what are the functional enhancers for a specific gene. Okay, so what we're doing here, we look at a specific output. So expression of the gene DHPS, and for all the input features we can use a method called deepSHAP that identifies which bins of that feature contribute most to prediction, and we can sum up these contributions and get a track like this, which tells us which positions along the genome the model thinks are important for predicting this gene. Okay, and those— that feature attribution approach gives us a prediction of where we think the functional enhancers are. Okay, there's data to evaluate this now, and this is thanks to CRISPRi-based enhancer screening strategies. For example, CRISPRi FlowFish from the NGRH lab. Okay, so this data, what they're doing is they're taking a particular gene of interest and they have a set of candidate enhancers and they do a pooled CRISPRi screen with the readout using RNA-FISH for the gene of interest. And they can, through sorting and sequencing, estimate the impact of perturbing individual enhancers on the expression, the full change of the target gene. Okay. And in the same paper, they have a model for predicting functional enhancers called the activity by contact model. This is a score using accessibility, acetylation, and Hi-C Okay, so how do we compare with the ABC score or with standard CNN models? What we can show is that the graph regulatory models from GraphReg outperform these other approaches. Okay, so this is an evaluation on FlowFish data and K562 cells. This is the performance by area under the precision recall performance profile curve over a set of genes. In green is ABC, orange are the different GraphReg models, blue are the corresponding CNN models. Okay, and so what you can see is that we have higher performance for determining functional enhancers based on FlowFISH data. With the GraphReg models in orange versus CNN models or ABC. And just a final slide to explain why GraphReg can outperform CNNs for this task. So what I'm showing is the MYC locus. MYC is an important gene. It's an oncogene. It's known to have very distal enhancers. Okay, so the promoter is here and I'm showing the HiChIP data. And the question is, can these different models through feature attribution— can we figure out whether they are able to detect these distal enhancers? And what you can see is both that the genome model-based models and the sequence sequence-based models, GraphReg can find these distal enhancers, whereas the CNNs can't. So 1D CNNs, the dilated CNNs, in principle have a wide receptive field, but actually the feature attribution shows they're only learning information very proximal to the promoter. Okay, they can't access this distal information, and that's And that's the power of this approach. OK, so I showed you some new work using graph neural networks to predict gene expression across large genomic regions using both 3D interaction data and 1D epigenomic data or using DNA sequence with 1D epigenomic prediction as an auxiliary task. And I showed that the graph reg models outperform the baseline CNN models for gene expression prediction. More importantly, we can use feature attribution to predict functional enhancers for genes, and this outperforms existing models as well as the ABC score for identifying functional enhancer elements. Okay, and I think the big picture here is that there have been rapid developments in machine learning modeling. In epigenomics and 3D genomics, and also in screening approaches based on CRISPR editing. And this has all enabled advances in modeling gene regulation and deciphering regulation. Okay, with that, I want to just thank all the people in my lab who did the work, Ali Reza Karbaleghiari is the postdoc who developed GraphReg. Marve Sahin developed the HiCDC+ package with help from Wilfred Wong. And in particular, I want to thank my collaborators Effie Apostolou and Danwei Huangfu, as well as funding sources.
Okay, great. Thanks very much, Christina. So let's go to a couple of questions just for this speaker before we move to the general discussion. I'll start with the first one by Jens Lichtenberg. How difficult would it be to infer the deconnectivity when assuming the other features such as epigenomic data and expression data are given or well known? And Christina, maybe we can just for the benefit of the audience, explain what is meant by the deconnectivity.
The connectivity, like the Hi-C contact map?
Yeah, I'm guessing what they mean is the Hi-C connectivity from this question.
Right, so that's a great question. So, you know, GraphReg uses Hi-C information, the Hi-ChIP information in the model to predict gene regulation. Another problem would be trying to use 1D epigenomic data to predict the contact matrix to predict—
Exactly.
And we and others are working on it. We are working on it in the context of using both bulk 1D epigenomic data as well as using single-cell ATAC data, sort of using different deep learning approaches. There are existing approaches that go from DNA sequence to the contact matrix training in a specific cell type, but one doesn't expect those models to generalize to a new cell type.
You have a question from Antonios Loutsas. Which starts off with saying great work, very exciting. A lot of the work that you're presenting is on population models, and I'm wondering if your ML models would benefit by using single-cell data in addition.
It's where we're going. You know, so I don't— you know, I'm not quite ready to put it into the workshop slides But we and many other people are looking at multi-ome data where you have single-cell ATAC and single-cell RNA-seq in the same cells. And the CAGE-seq that we're using looks very much like the signal you get when you summarize single-cell data, especially certain kinds of assays over cells, over clusters. So we are definitely heading in that direction, as are many other people.
Great.
And actually, maybe I'll ask you a question on my own. You know, in natural language processing, there was kind of a phase transition when transformer models came in, you know, and you see kind of the rise of BERT and GPT-2 and 3. Kind of your thoughts on whether transformers would be useful in this domain, which at least to me looks a little similar.
Yes, I was actually just reading a paper yesterday which is from Calico and DeepMind, David Kelley's. So it's a preprint and our GraphReg is also a preprint, so they're both available in bioRxiv. And they're using a transformer architecture, you know, so it's a different attention-based mechanism. They're not using 3D structure, but they can through an attention mechanism get some longer-range interaction, not quite the 2 megabases that we are getting, but that they can kind of learn information up to about 100 kb, which is impressive.
Okay, great. So why don't we go ahead and get all the speakers of the session up here and we'll start the general discussion period.
And, you know, maybe while we're waiting for some new questions to roll in, I have a question again for Jianpeng. You know, it was kind of amazing to me how so much of the advance in protein structure came from methods that are based on information theory or evolution. Rather than from a biophysical approach. You know, your thoughts on why that is and whether or not we'll actually get to a place where the biophysical approaches kind of catch up to the more information-theoretic approaches.
Yeah, sure. So I think first, the biophysical-based approach has their limits, right? There our current understanding on, for example, man-body interaction and the exact formulation of these, how this potential should be formulated, are not complete. Where we have very— although there are a lot of progress in the field, we have— we don't have very much understanding on these. And also, the biofix-based approach also suffers from what we have seen in optimization. There are a lot of issues in optimizing. Those energy functions are are highly rugged. They're in the landscape. People have visualized that there are a lot of local minimum, and those energy functions are really, really hard to optimize. So I think that's the main bottleneck of applying those approaches in large scale. And of course, the computational costs of those biophysical-based approaches are really, really demanding, and we need a lot of supercomputers to perform a lot of simulations and to get some reasonable folding or simulations. So I think the future direction might be the, like as you said, the information-based, information-theoretical-based, or machine learning-based plus physical-based approaches. For example, in our approaches and also many other groups, especially also in DeepMind's approach, we're not just only use the deep learning approach. For example, for protein structure prediction, protein folding, What the machine learning is giving us is just the initial structure. We got this scaffold to be right. We know, for example, this particular residue should be placed in the, in the right direction, but the details are not good. So usually what we do is that after we obtain the initial structure, we use a force field or some of these biophysical-based approach to optimize also atomic details, a lot of sidechain packing, orientation, etc. Because before, if we don't have that, the structures globally, they look correct, but if you look at the detail, they, they are not useful at all. So that's why people now use these kind of different approaches and put them together. And, and, and machine learning, I would say, is very good at identifying a good starting point. After we find this good starting point, and then the biophysical model will be be very helpful, useful to optimize the detail and get them folding to the right structure.
So a question just came in that I have to say I have been wondering during a number of these talks, and so I think it's a good general question for everyone. How much data do you think is needed for genomic deep learning? And I would say you're welcome to comment more generally, but start with your own research. And let's start with Christina Leslie, because, you know, But Christina, during your talk, I was wondering, you're running this thing, obviously you're scanning it along the genome from chromosome to chromosome, and you mentioned you can use one chromosome as a holdout to validate the model on others. But is that just one individual? Presumably you have multiple individuals. And so we have these sort of at least two dimensions, number of nucleotides by number of samples. Is that how I should think about this? And how much data do I need?
In both of those dimensions? So let me point out that the data I'm showing you is training on a single cell type. And it's ENCODE cell line data or mouse ES cell line. And a lot of work so far has been at that level. Or maybe you do multitask where you're predicting all of ENCODE, but fundamentally, It's predicting it from the reference genome. And as we move forward, it's not magic. We're going to need to incorporate genetic variation into the models if we really want to learn what is the function of non-coding genetic variation on gene expression. And we have some strategies. Other people have strategies as well.
But that's the next step. But for instance, do you have any estimation of how things will improve as more data are added, as more cell lines, for instance, are added to the repository?
Is that going to help? I don't know. So I actually think instead of cell lines, I think we need primary cells looking at differentiation stages, like in our 4DN project. We want to model something that is relevant both to cell identity and, you know, the biology of the, you know, fully differentiated cell and the biology of disease, right? So I think we should be training in more relevant contexts. In terms of learning, you know, so the epigenome-based model that I talked about where from a few marks and the connectivity, you know, you're— we're learning something fairly modest about how contributions of distal elements and the state, you know, helps us predict the level of expression output. And so it's not surprising in a sense that that does well. We have good information. That can generalize to a new cell type pretty well. But it doesn't get us all the way to what does this, you know, the minor allele change in regulation of an important developmental gene.
So Sarah, how would you answer the question about how— so how much data are you using? And what are your views in general on obtaining more data and how it would impact the machine learning you're doing.
Yeah, I think it's a different application than what Christina was talking about, but we still— we do use the entire genome, but we would do that for multiple individuals, usually say 200 haplotypes, so 100 individuals. And I think it hasn't been explored enough, you know, how many we actually need to do well. Could we get away with fewer? You know, I think there's kind of some interesting questions there. I think it depends on what you want to answer. For natural selection, you may need more individuals to really see that pattern. For things like ancient population size changes and migrations and admixtures, you may need only fewer individuals. But I think in terms of— I'm also sort of chopping up the genome into regions and I'm trying to look at feeding each of those regions in almost as an image to the GAN framework. So how many images do I need? I mean, I would say a lower bound would be something like 10,000. I mean, just to throw it out there. So that kind of would— there's a trade-off between taking more SNPs per region and having fewer regions versus taking fewer SNPs per region and having more regions, right? So I think there's a lot of exploration that needs to be done there. But we're kind of, for a GAN, we're limited in just the length of the genome, right? Whereas for some supervised machine learning method where you're using simulated data to train, there's no limit to the amount of training data you have, right?
It's just, is it actually good quality training data? Great, thanks.
John, did you want to comment as well? Yeah, I want to just add one comment that although for a lot of problems like we don't have, for example, we don't have a lot of cell lines, we don't have a lot of samples. We don't have too many genomes, or we don't have too many proteins to train all these models. But essentially, you think of all these modern deep learning models, they are trying to capture these local patterns from very bottom and organize in a way that to come up together with more complex organized patterns. And a lot of this, if you think of these local filters or local feature extractors at a very lower layer in these models, the— we actually get a lot of data, right? One, we have 3 billion base pairs in the genome. Each of this region can be seen as individual data points. Of course, depends on what kind of task you want to do. Like, for example, for proteins, like, we don't have a lot of protein solved, although much more than we've seen in the past. But essentially what we're trying to do is find all these interacting motifs. Those are local, local interactions. So essentially, I would say why these deep learning models work is that we, although we don't have a sheer large number, large sheer number of how many samples we can get, but within each sample we actually can construct a lot of useful information to create the data points.
That's what I want to comment on. Excellent. So, you know, actually, uh, Anshul Khandaji, uh, asked a good question in the chat here. About what you could say in general for stability or instability of deep learning models, if not in fact all classes of ML models. Maybe we'll start with Christina.
Would love to hear your thoughts on that. Yeah, so we're, I mean, moving into this deep learning space because I think the models are very exciting and flexible and they're allowing us to do do things that we couldn't do with the previous generation of machine learning models. But I think Anshul is exactly right that it can be scary how unstable they are. And you do have to use good machine learning practice. Right. And you have to use ensembles. You have to be very careful not to fool yourself, as with all machine learning, that you're really generalizing. So, yeah, I agree it is something that we all have to be cautious about.
Just to push on it a little bit, Christina, how does the stability change as you start to add even more parameters or more complexity, you know, there's a certain kind of theoretical strain of thought that's arising around overparameterization actually being kind of useful rather than detrimental. So as our models get more complex, will they get more stable or less?
I, you know, I don't know that we can make a general statement, but yes, we've also seen these papers and all and also empirically the idea that you want to over-parameterize and maybe it makes your gradients better, right? And more ways to kind of approach a solution. It's very interesting. I think it's sort of a lesson for learning theory that the algorithm is part of understanding whether you overfit.
Excellent. Maybe we'll go on to a few other questions just to divide it up. You know, maybe Stephanie, you could say a little bit about what are the right inductive biases to use for genomics. And again, just because it's a general audience, maybe you can start by saying a little bit about what is meant by the term inductive bias. Sorry, I meant to say Sarah.
Sorry about that. Okay, okay. Yeah, I think it also maybe depends on the application a little bit. I think there's sort of, I guess, biases in the data itself. And then there's also biases in terms of the methods that you choose, right? And that might be your own inductive bias about what you think will work better. I think in population genetics, this is— this kind of manifests itself as choosing models we think are realistic in terms of evolutionary models, say, like clean splits between populations. And, you know, it kind of— we oversimplify in that case. And I think that that can lead to some inductive biases. I think they would be a little bit different in each field, but I think I think what I would like to see is actually methods that allow you to move between models. So often we fix the model and we fit it, right? In terms of, say, a two-population model with a clean split and no admixture since the split. So what could we do to actually allow the method to explore models and so that we are not constraining ourselves in that way? I think that would be be super interesting and would kind of get us away and maybe explore solutions that we didn't think were really feasible but actually happened over evolutionary history.
So one discussion point that keeps coming up, I think it came up in Sarah's Q&A, but I think is good to discuss as all of us, is this role of simulated versus real data. And in particular, the role of simulated data in what all of us do, you know, who are up here on the virtual stage. On the one hand, simulated data can produce virtually an infinite number of training samples and has lots of other benefits. On the other hand, if you're not careful, you've stopped learning about human biology at some point and you're learning about how this machine learning algorithm works, which of course is less interesting. So, Sarah, why don't we— I'll maybe leave you on the stage or, you know, on the floor, so to speak, and maybe you can comment, you know, just in general, how do you think about simulated data and when are the appropriate uses versus when are the inappropriate uses?
Yeah, it's a great question because I think that in population genetics we've relied on simulations, you know, really heavily, perhaps, you know, more than most fields. That's really because we can't really go back in a sense in the past and find this evolutionary ground truth. So if we wanted to infer historical mutation rates or recombination rates or population size changes, we don't have the ground truth. So we are forced to rely on simulated data for anything that's sort of supervised, broadly defined. However, I would say it's not as bad as it sounds because we do have actually very good evolutionary models. We know how to do the forward process. We just don't know how to infer— or that's the goal of population genetics, sort of to infer going back in time what actually happened. So I think that's— that it's still— it still hampers us a bit because we only can simulate some things that we think are real. But I think we do have very good evolutionary models. I guess there's two exceptions to that. One is ancient DNA. So if we had really good ancient DNA, we could actually have some ground truth. However, it wouldn't be nearly enough to train any— okay, that's what I think right now. It wouldn't be nearly enough to train any machine learning model. And two is experimental evolution. So you can do this in yeast, or you could do this in, you know, some other type of fast-reproducing species. But I don't think you're going to be able to do experimental evolution for humans. Human, right? So, I think that's where we will maybe always rely a little bit on simulations to test our model, to validate our model. Does it produce reasonable things in simulations? Maybe we can sort of triangulate with different models and say, okay, if all these models were tested in simulations with different caveats and things, and they all produce the same result on real data, maybe we start to feel confident this is a real result. But without external validation techniques, weeks. We won't exactly know what happened, you know, thousands of years in the past. I think there's a power of GANs, that's what I'm interested in right now, to help us make better simulated data, more realistic simulated data. I think we should think about underlying structure in the data, clustering and things, visualization that helps us learn more about the data in an unsupervised fashion, but I think we're always always going to rely a little bit on simulations.
John or Christina, did either one of you want to comment?
I mean, I think it's not clear how we do data augmentation in the genomic setting, right? Whereas in the image setting, there's lots of strategies to augment your training.
Data.
So, you know, augmentation in a way that doesn't bias badly.
I would say the simulation data are useful to validate hypotheses. So basically, you want to develop a method, you want the method to capture certain, like, inductive bias you believe to be true for this this particular biological problem, then you like to simulate the data so that the data have the property you wanted it to have, and then check the model is useful or not to detect this kind of thing. So essentially, I think all of these questions and the previous question are all related in a sense that what do we really want to do, or to use this machine learning or deep learning approach for, whether we just want them to improve predictions That's okay. And for example, we want to predict the protein structure. Sometimes we don't need to worry about how these structures are generated as long as useful, right, for drug discovery, etc. And for many other fields, like especially I know in the system biology and regulatory genomics, people want to generate, find the tools that are able to identify certain knowledge, right, certain kind of interactions. We don't know whether those are— these are kind of— sometimes these interactions are very complex, so we, we don't know whether the method is able to mine such a relationship. So we generate the data set so that we can learn these kind of patterns. So this also comes back to their original question: why— what is— how do we actually use deep learning the right way for different problems? I would say for many problems in genomics The accuracy is secondary, right? We don't really want to push the accuracy to be very high. We want the model to be insightful too. We can use the model to discover a lot of new knowledge, a lot of new interaction, new insights that would be better for us to better understand biology. So I think all of these are interrelated questions and it's all about how we actually design the right methodology to interrogate the data, to identify what are the purposes are, whether we want to make the accurate prediction for some downstream analysis or downstream applications, or we want to find a new biology and better understand the biological system.
And thanks for the segue to interpretation or explainability. So one thing I was going to ask you, Jian, is both Sarah and Christina got questions about interpretability of of their models. You didn't so much, so I was going to ask you, how do you think about interpretability or interpreting the models, say, you're building for structural proteomics and protein folding?
Yes, so we actually consider that very much. So for example, when we build a model to predict a protein structure or protein contact structure or interactions, we actually visualize. So there are a lot of approaches developed in the field to visualize activations of certain layers in your neural network. So we can, we can, for example, you can essentially what you want to do is to take the gradient with respect to the input, right? And or you just across different type of data, you visualize which neurons are activated. In this way, we can actually go backwards to the original sequence of structure to identify whether there are some relationship between, for example, two beta strands or two alpha helical structure interacting with with each other. So we also do that, check that all the time. But instead, I would say that our— the goal of this problem we study is kind of different from other genomics problems. We want to push the accuracy to be to a regime that we can use a prediction. And for the other field, like Trey, you have done a lot of work in this field, we all understand that. We want to figure out what the model actually learns. Basically, essentially, I would say the— at the end of the day, then what do you actually learn that can be transferred, can be generalized, are the very simple rules, right? Some biological rules. The rules are noisy rules. We cannot easy to learn using very simple models. So that's why we need deep learning. But finally, we need to distill this kind of knowledge from the model. One way is to using this interpretable approaches, like a post-analysis, right? After you build a model, you want to analyze what you have learned. Another way is like what you did and others did, is you use this inductive bias, build the model in a way that the model already incorporated necessary knowledge of biological information into the model so that you can visualize the model and make conclusions and find new discoveries, right? So I think those are two different approaches people widely use in the field. I don't know which one is better. I think Both have their own virtues. And but I think this will be the— I think it will be very important research area in the future.
We—
because in the end, we want to discover new biology, want to better understand the biological system.
Yeah, I would agree. And what I presented, you know, it's very important to be able to predict gene expression because you want to learn the mapping from the epigenome or the genome genetics to expression, but actually, you know, expression is the easiest thing to measure of all the things that— Right. —model, right?
That's right.
If you just wanted to predict, you could just measure it.
Exactly. You know, I have a question for the panelists that's a little bit more related to kind of training. One of the things you all three have highlighted is the challenges of actually getting your models trained. And there's a fair amount of kind of knob turning that has to happen. And that's the kind of thing that really is the domain of experts who really learned in an environment how to do it. But, you know, now imagine your lab, you're a lab that hasn't yet done a lot of work in machine learning, and you want to start being able to build your own models and being able to apply them to the kind of question of interest, What's the best way to get up to speed? Is it by finding a collaborator, recruiting a postdoc that knows how to do it, or just blood, sweat, and tears?
Maybe Christina, you can start. I'm a big believer in bringing in postdocs who are well trained in the area and get them, you know, getting them excited about biology, right? And having a training environment where you can say, look, 'You know, you have exciting methods, but we have the real problems, right? And we can put this methodology to use in a really impactful and meaningful and biologically sensible way.' So yeah, so you have to lure them away from Google and Facebook and get them in your lab.
So you mean there are some people who'd rather work on cancer than selling ads?
Yeah, this is all that you— all we have is, you know, come cure cancer. We can't offer the salaries, but we can—
there is a mission. You know, I see we're almost at time, so maybe you actually will just end on that note. I thought this was just a wonderful session. I'd really like to thank all of the speakers. There are many questions. We actually really greatly questions that we didn't get to today, but I thought this was a great discussion. Thanks everybody, that was fantastic. Thank you.
More from Joshua







Scientist Stories: Hans Waterham, The value of phenotypic assays in peroxisomal disorders




Scientist Stories: Joel Zlotogora, Genetic carrier screening programs for reproductive purposes