Scientist Stories: Aviv Regev, Inventor of breakthroughs in single-cell genomics
In this talk, Dr. Aviv Regev (Genentech) presents a comprehensive view of how single‑cell RNA‑sequencing (scRNA‑seq) and spatial genomics can dissect tumors as complex ecosystems composed of cancer, immune, and stromal cells. She defines "hot" (T‑cell‑inflamed) versus "cold" (T‑cell‑excluded) tumors and explains why only a subset of patients respond to checkpoint‑inhibitor immunotherapy. Using scRNA‑seq data from melanoma patients, her lab identified a coordinated cancer‑cell gene program that drives T‑cell exclusion, characterized by low MHC‑I/IFN‑γ genes and high MYC/CDK4/6 targets. Spatial protein profiling validated the spatial segregation of cells expressing this program. The program’s expression in bulk RNA‑seq cohorts predicted poorer outcomes to immunotherapy, prompting a drug‑repurposing screen that highlighted CDK4/6 inhibition (abemaciclib) as a means to repress the program; combined checkpoint and CDK4/6 inhibition reduced tumor growth in mouse models. Cross‑cancer analysis of TCGA data showed the program is prevalent in immunotherapy‑resistant cancers, with synovial sarcoma regulation driven by the SS18‑SSX fusion. To dissect the program mechanistically, the lab employed Perturb‑Seq coupled with DNA‑barcoded antibody (CySeq) profiling, perturbing 248 candidate genes. Viability screens identified known resistance genes (β2‑microglobulin, HLA, JAK/STAT) and novel ones (CD47, CD58, CDH19). Regulatory matrix analysis uncovered six perturbation modules affecting four gene programs, revealing CD58 loss as a distinct resistance mechanism that induces PD‑L1 without altering antigen presentation. Finally, the computational method "Dialogue" was introduced to discover multicellular interaction programs without prior assumptions, uncovering immune‑cell coordination programs linked to immunotherapy response in melanoma and colorectal cancer, including distinct multicellular communities (inflammatory luminal hub, immunity hub). The talk concludes that integrating single‑cell genomics, spatial profiling, perturbation screens, and novel computational tools enables prediction of patient outcomes and identification of new therapeutic targets.
Chapters
Thank you, and hello everyone. Welcome to this session, and our first speaker will be Dr. Avi Regev. Executive Vice President from Genentech in the United States. So, Viv, take it away. Thank you.
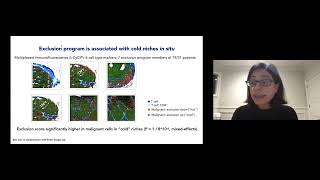
Thanks, Pam. Let me share my slides. Thank you for the opportunity to be here today. They should be looking fine now. So I have to actually start with my disclosures. I'm a co-founder and have equity in Celsius and Immunitas, and I was an SAB member in Thermo Fisher, Neogen, and Syros. And from August 1st, 2020, I'm an employee of Genentech. I'm going to talk today, like others, about tumors that you can think of as complex ecosystems that are made of different kinds of cells. And that means not just different cancer cells with different mutations, but also different types of immune, stroma cells and others. And so the interplay between these different cells in the tumors can promote tumor growth, but it can also offer important opportunities for therapy. And really, one of the most remarkable examples of this in the past decade has been immunotherapy. So one of the non-cancer cell types in tumors is CD8 cytotoxic T cells. These are cells that can recognize and kill cancer cells. But cancer cells can respond to this by using molecular mechanisms that we call checkpoint molecules in order to exhaust the T cells. And so a form of immunotherapy called checkpoint inhibitors inhibits this axis, and this unleashes the T cells to kill the cancer cells and bring benefit to the patients. Now, unfortunately, for some, some cancer cells and some tumors still find ways to evade this and to avoid T cell killing. And so as a result, only some patients benefit from immunotherapy. And in other cases, the tumors are resistant. One hypothesis has been that this resistance is associated with a difference in the T cell populations of the tumors. So some tumors might be cold, they don't have any infiltrating T cells, whereas the responsive tumors are hot and they're filled with T cells, which you see here in the color red. And so in fact, scientists sometimes categorize now tumors by the portion of T cells and where they are located. At one end of the spectrum are these hot inflamed tumors with a lot of T cells inside them. At the other end are immune deserts with no T cells in sight. And in between are the immune-excluded tumors where the T cells are at the periphery, but they haven't infiltrated the tumor. And so if we want to understand better cancer, but also treat patients better, we need to be able to look inside tumors and figure out the molecular mechanisms within and between the cells that drive it. And then just like in the case of checkpoint inhibitors, we would want to intervene in these mechanisms and help the immune system do what it does best, which is to kill tumor cells. So ideally, we would be able to look at each individual cell in a tumor— cancer cell, immune, stromal cell, and so on— and characterize each of them by the molecules that they have, for example, the RNA that's expressed from each gene. But how might we go about it? Well, until quite recently, we used to do this by taking hundreds of thousands or millions or billions of cells in one tumor and measuring their average. And if you think of each cell in the tumor as a piece of fruit, this This means we generated the lab equivalent of a fruit smoothie. In the last few years, a method that we developed called single-cell RNA-seq allows us to measure the expression of genes in each cell separately. So you can think about that as a fruit salad. And with more recent spatial genomics technologies, we can actually profile cells that are organized together in the tissue. So a fruit tart. Today I'm going to focus mostly on single-cell RNA-seq. One of the challenges with methods like these is that they generate very complex, very noisy, and very big data. Each cell has about 20,000 genes in the genome. And if we characterize it as a point in a high-dimensional space where the number of dimensions equals the number of genes, it's not just 3 dimensions, it's 20,000. And that's very hard to reason about intuitively. But algorithms are really great at discovering the patterns in the data and reporting them back for different cell types and states and how they change over time and the gene programs that they use and even where they're physically located and how they interact with each other. So today I'm going to share with you several vignettes on how we use these kinds of approaches to try and dissect tumors and understand the relationship between cancer cells and the immune cells. And I'm going to start with melanoma, which is one of the first tumor types where there was a major benefit to patients from immunotherapy. So several years ago, Livnat Gerbi and Ben Izar, when they were postdocs in the lab, used single-cell RNA-seq to profile tumors from 31 patients, half of them not yet treated and some— and half of them after treatment. All of them were non-responsive. And Livnat and Ben wanted to know if cancer cells from some patients have properties that make the tumor better at excluding T cells and as a result, more resistant to immunotherapy. So they pulled only the cancer malignant cells from their data, and each of these cells is shown here as a colored dot on these plots on the right, and it's positioned in two dimensions based on its profile. In the top plot, the cells are colored by patients, and because tumors are very different, each patient's cells form a separate group or cluster. But what we want to find is what might be shared between the tumors of different people, and so we're looking for these common features. For this, Yvonne developed a computational method that looks across many tumors in order to find features in the profiles of cancer cells that correlate with the frequency of T cells in the same tumor. That means she's looking for genes that are expressed only in cancer cells, but they're higher, for example, when the T cell levels in the tumors are higher, or they might be higher when the T cell levels in the tumors are lower, so anti-correlated. The result was a coordinated gene program in the cancer cells, which we call a T-cell exclusion program. And in this program, we have genes like MHC class I or interferon gamma that are low in cancer cells in cold tumors and high in hot tumors. And we have genes like MYC target, CDK4, remember that gene, and CDK targets that are high in cancer cells in cold tumors and they're low in hot tumors. Then we wanted to make sure that we see this program in the original tumors. So we went back, you know, to the fruit tart. We use the method that measures multiple proteins in sections from 19 of our patients. And this allows us to mark the key cell types and the exclusion program. So just to orient you, here's one section. In blue, you see the T cells and the CD8 T cells are in light blue. Red cells are cancer cells that repress the exclusion program. So we should, we expect them to promote a hot environment.. And green cells are cancer cells that induce the exclusion program, so we expect them to be in a cold environment. And this is exactly what we see, the red malignant cells are interlaced with the blue T cells, but the green cells make these big cold patches. So now the bigger question was, would this program be related to the patient's response to immunotherapy? For this, we studied a new cohort of 112 patients in collaboration with Dirk Schadendorf and Elie van Allen, where the patient tumors were biopsied before the patients were treated with checkpoint inhibitor and profiled by bulk RNA-seq. And then the patients were followed to see the clinical outcome. And we found that a higher expression of the exclusion program in these tumors before treatment actually predicted a worse outcome for the patients. So of course, we would want to find ways to inhibit this program and suppress it as a new therapeutic approach. So we used another computational method to analyze RNA profiles from hundreds of cell lines that were treated with drugs, looking for drugs that would be more toxic to tumor cell lines that express this program. And we found that CDK4 inhibition would repress this program. Now, you might remember that I told you that CDK4 and targets of CDK4 and 6 were actually included in the exclusion program. So we tested this idea first in cell culture, we used cell line, and then we grew even malignant cells that we isolated from the tumor together with T cells from the same patient tumor, and treatment with the CDK4/6 inhibitor drug called abemaciclib reversed the expression of the program. And finally, we showed that treating animal models of cancer with a sequential combination of first checkpoint inhibitors and then the CDK4/6 inhibition reduced tumor growth. Now, at this point, we also asked ourselves, is this unique to melanoma, or could this be found in other tumor types as well? So we scored bulk RNA-seq data from multiple tumors in the Cancer Genome Atlas. And we found that cutaneous melanoma, lung adenocarcinoma, and kidney cancer all have relatively low scores. And that's consistent with the benefit of immunotherapy in these tumors. On the other hand, cancer types that are typically not responsive, like uveal melanoma and colon cancer, have relatively high scores. And the highest score was in synovial sarcoma. Which we later showed also expresses this exclusion program, and it is also related there to actual T cell suppression and exclusion. And it turns out that in synovial sarcoma, the expression of this program is controlled by the main genetic driver, which is a fusion protein called SS18-SSX. So to summarize this first part, I showed you how we use single-cell genomics to make a statistical prediction about the program in malignant cells that leads to T-cell-excluded tumors. We validated that it predicts the response to immunotherapy in two independent cohorts. And then we predicted that it can be reversed by CDK4/6 inhibitors. And we validated that in cell and in animal models. And then we also saw that this program is likely present in cancer cells of other tumor types, and we validated that in synovial sarcoma. But now, can we take a complex program like this and now try and take it apart and figure out what's going on? Now in the first study I showed you, we really followed just one pair of genes, CDK4 and 6, out of dozens and dozens of genes in this program. And to be honest, this was because we conveniently had this drug that already inhibits them that somebody developed. But if we want to test every gene for its effect, we need to use a genetic screen where we knock out each gene in turn. And also we want to see the effect on a complex program of genes. And so we need to measure the impact on an expression profile.. And then we need to conduct the experiment in a co-culture. We're going to genetically manipulate the patient's melanoma cancer cells, but we grow them together with T cells from the same patient in order to see the effect. And so Chris Frangi, Johannes Melms, Pratikshatha Kaur, and Katie Geiger, in collaboration with Ben Izar, decided to pursue this using a method we developed a few years ago called Perturb-Seq, where we grow all our cells together. Perturb each of them genetically using a different genetic reagent, which is barcoded with a unique sequence. And then at the end of the experiment, we do single-cell RNA-seq. And this gives us both the identity of the genetic perturbation and the impact on the profile of the cell. Now, we had one more remaining challenge. And this is because many of the best established ways to decipher what is happening to the cells is based on looking at proteins on the cell surface. And some of the most canonical proteins are actually very nicely detected on the cell surface, but their RNA is not sufficiently well detected by single-cell RNA-seq. And so we modified the Perturb-seq method in order to rely also on a method called CySeq, where we stain the perturbed cells by DNA barcoded antibodies so that we can measure the level of these antibodies in the profiling as well. And with this new setup, we perturbed each of 248 genes in the exclusion program, inside the patient-derived melanoma cells. And then we assess the impact in two ways. One was using the cell viability in co-culture with T cells to see if T cells were killing the cancer cells. And the other was on the cancer cells RNA profile. And so first in the cell killing screen, the strongest, strongest hits were in genes like beta-2-microglobulin, HLA, and the JAK/STAT pathway genes, which when we perturbed them in the cancer cells gave these cancer cells resistance to T cell killing. And this is what we would expect, so it's a nice positive control. But there were also additional genes that conferred resistance when they were perturbed, including CD47, CD58, and CDH19. And again, remember CD58. So now we wondered, are these working through the JAK-STAT pathway that we know would confer resistance, Or is it a different mechanism? For this, we turn to the PerturbSeq screens, where we analyze the profiles of 200,000 patient-derived melanoma cells, and use the computational model that fits what we call a regulation matrix of the impact of each perturbation on the mean expression of each gene across the cells. And the most prominent portion of the regulation matrix, which I'm showing here, is consistent with the viability screen. JAK/STAT in the interferon gamma receptor inhibited the program of MHC and antigen presentation genes, chemokine interferon response genes, and so on. But their perturbation also induced genes like CD58 that I'll come back to. So after we had again a good positive control, we looked at the exclusion program genes. And when we perturb the JAK/STAT pathway genes, the program is increased. But perturbation of 22 other genes, including CDK6, MYC, ILF2, DNMT1, and ASCAL3, repressed it. CDK6 is the one regulator that we already had before. But now we have multiple others that we could try and inhibit in order to repress this program. And so then we wanted to see how all the pieces wire together. For this, we looked at the rest of the regulation matrix of the impact of the perturbations on RNA and proteins. So on the other one hand, we can cluster the perturbations and we can find modules of perturbations that have a similar impact across the RNA and proteins. On the other hand, we can group the RNA and the protein profiles, and we can find programs of genes that are coregulated across the perturbations. And altogether, this gives us 6 modules that impact 4 programs. For example, in Module 1, you have the regulators SOX4, RB1, ST100, and IRF3 that activate a program of the cell cycle, metabolism, inflammation, and checkpoint genes. SOX4 and RB1 inactivation was already shown to impact the response to immunotherapy, And these regulators themselves are actually repressed when you perturb the JAK/STAT pathway. So it's downstream of that pathway. On the other hand, the same program is repressed by Module 2 with genes like CD58 and CXCR4. Now, this is a very short talk, so I don't have time to go through every detail. But this model is like a map now for all the different mechanisms related to exclusion or resistance through this particular program that we started with. And to illustrate this, I'll highlight just one example, CD58, which I mentioned before and will now recap. So CD58 is part of the repressed side of the exclusion program in the patient tumors. CD58 knockout cells are more resistant to T-cell-mediated killing in viability screen. CD58 is not just activated by the JAK/STAT pathways, actually it's induced. The CD58 knockout has a different phenotype than the JAK/STAT knockout in the perturbed side-seq screen.. And it didn't affect the expression of antigen presentation genes. And so altogether, this led us to hypothesize that CD58 loss is a distinct resistance mechanism. And CD58 is an adhesion protein. It's typically expressed on the surface of cells that present antigens, and it binds to CD2, another molecule, on CD8 T cells and on NK cells. And it has come up before in T cell killing screens, but there's little known about it, relatively speaking, because there's no ortholog in the mouse.. And so we validated that CD58 knockout, sorry, CD58 knockout melanoma cells are resistant to both T- and NK-mediated killing. And we also validated the perturbed CytSeq result that the CD58 knockout doesn't impact MHC class I or II expression, but it does induce one of these checkpoint mechanisms, PD-L1, which may be one of the mechanisms by which it impacts resistance. And finally, we went back to the patient's original data, and we saw that it is downregulated in patient cells after immunotherapy. We've now gone global from 248 to the whole genome with a genome-wide perturbation screen for regulators of MHC class I in melanoma cells with another tweak to this Perturb-seq method. So to summarize this second part, I showed you how we used Perturb-sight-seq to drill into the T cell exclusion program. We parsed out this well-established JAK-STAT module, but also 4 other modules that govern 8 programs, including the exclusion program.. And one highlight is the distinct role of CD58, but there's many other regulators and story in this map. Okay, so in the last couple of minutes, until now, we tried to dissect the tumor to its component cells and then assemble them back together. And for example, we focused on cancer cells and CD8 T cells because honestly, we already knew that they interact with each other and that the interactions is important. But can we do the inverse? Can we use the data with no assumptions and look for multicellular units of cells that interact with each other and might be important for the tumor? And the short answer to this is yes, we can. And the basic idea is very simple. We expect cells to coordinate their action in the tumor, either because they're all responding to the same signal or because one of the cells impacts the others. And in any case, we expect this signal in the data to reflect the coordination. And to find this kind of signal, Livnat again developed a computational method which we call dialogue. And here it learns a way of representing the cells in ways that show the dependencies between them, either across different physical niches or across samples or across conditions. So to illustrate this in cancer, here's data from a published melanoma study where 48 patients, 31 responders and 17 non-responders, were profiled by single-cell RNA-seq. But this study profiled only the immune cells in the tumor. So we're going to focus on how they relate to each other. And here is one of the multicellular programs that we now discover. And it is associated with a response to immunotherapy. So the induced part of this program is higher in responders versus the non-responders. And the repressed part has the opposite pattern. But unlike before, where the program I showed you was made only of genes co-expressed in one cell type, Here we have different genes in 4 different immune cell types that coordinate their expression. So as a result, the program connects macrophage M2 polarization, the repression of a gene called APOE, and T cell dysfunction. And it also includes a gene called CXCR6 as repressed in CD8 T cells. And we have in a different study shown that CXCR6 is a pan-cancer marker of dysfunctional CD8 T cells, and it's needed for interactions with myeloid cells in the tumors.. And I am pretty certain you're going to hear more about these kinds of cells and interactions from Miriam and Zunim today. And now it turns out that we can apply these approaches to many tumor types. So for example, there are two main types of colorectal cancer. 15% of patients have tumors with a lot of mutations, very hot with TILs, respond to immunotherapy, but 85% of patients have tumors with far fewer mutations, typically cold, and don't respond to immunotherapy. We went through the exact same thing I showed you. Lots of patients, lots of single cells, lots of programs. The difference is that we also looked at how the programs co-occur across the tumors for different cell types. And in doing so, we found 6 major multicellular communities, including an inflammatory luminal hub of specific cancer immune and stroma programs in both tumor types. But we also found a unique anti-tumor immune in Immunity Hub, which is only present in these inflamed tumors that respond to immunotherapy. And there's a lot of upcoming methods that are going to help us characterize these kinds of communities and their mutations. So to summarize the final part, I showed you how we moved from cellular to multicellular programs that relate different cell types and their programs across patients, niches, or conditions. Some of these multicellular communities, like some of those in melanoma, colorectal cancer, there's also pancreatic cancer and more, relates to the patient response to immunotherapy. Therapy or to survival. And upcoming experimental and computational methods will help us better discover these multicellular programs and understand their role in tumor immunology. So I told you today about how profiling single cells helps us understand immune phenotypes in tumors, dissect their cellular component, dissect their molecular circuits inside the cells, build back the multicellular communities, and help us ideally predict patient outcomes and identify new targets for therapeutic intervention. I want to thank all the people who did the work. I mentioned them throughout, and I look forward to questions and the discussion later on. Thank you very much.
More from Joshua







Scientist Stories: Hans Waterham, The value of phenotypic assays in peroxisomal disorders




Scientist Stories: Joel Zlotogora, Genetic carrier screening programs for reproductive purposes