Scientist Stories: Fei Chen & Jason Buenrostro, Visualization of the Dynamic Epigenome
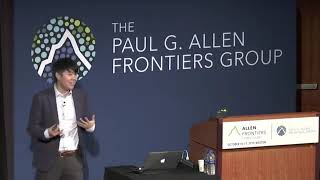
Fei Chen and Jason Buenrostro developed a method to map where genes sit in 3D space inside cells and which ones are active. They use Tn5 transposase to tag open DNA, then rolling-circle amplification to create readable spots, and a custom sequencer to read them in place. The technique reconstructs chromosome structure from single cells and reveals that homologous chromosomes behave independently, with no coordination within the same cell.
Questions this video answers
The radial segregation reflects lamin‑associated domains (LADs) and gene density: larger, gene‑rich chromosomes tend to localize toward the nuclear interior, while smaller, gene‑poor chromosomes are more peripheral. This pattern aligns with A/B compartment segregation observed in Hi‑C data, suggesting functional rather than purely geometric optimization.
Chapters
It's my pleasure to introduce the first talk of the session. Dr. Fei Chen and Dr. Jason Burmestro are from the Broad Institute, MIT, and Harvard. Going to be talking about multimodal visualization of dynamic epigenome. Fei?
Am I good? Okay, yeah. Yeah, I want to first thank the organizers and the Allen Frontiers Group for organizing such a great conference and giving us the opportunity to talk about funding us to work on this work. And I want to really point out that this work is a really close collaboration between me and Jason. And it was actually really quite amazing that Jason and I were just starting our labs, and we threw out this really ambitious idea, and we were so lucky to have been funded by the Frontiers Group. And I also want to point out that beyond just me and Jason's lab, we also are embedded in a community with George Church and Ed Boyden's lab, who are also developing the set of platform of in situ sequencing technologies. And really, so just to get right to it, we're really interested in how the organization of the genome leads to, and also by proxy, the epigenome leads to the function and how it regulates gene expression. And really, as it was alluded to yesterday by a series of beautiful talks, the genome is exquisitely organized on many different scales, right? And there's an immense amount of heterogeneity in its organization, but that heterogeneity is structured in ways that we can understand. So, yeah, you can go from like the 30-nanometer chromatin fibers, and they're packed on— they're wrapped around nucleosomes, and We saw yesterday that they're not— maybe not quite 30 nanometers, depending on how you look at them with EM and what cell type they are. But then these things are organized into what we believe to be topologically associated domains, or like domains which may or may not be phase-separated, you know, as we saw yesterday. And then these things are organized, at least in the non-mitotic chromosome, into chromosome territories, which are just areas in the nucleus where in these individual chromosomes like to hang out, and you can see that, you know, here. And, you know, we've observed chromosome territories for decades, and, you know, each cell actually has like— there's a lot of inter-cell heterogeneity within the organization of the genome, but, you know, there's relatively conserved function and organizing principles that we'd like to elucidate. So, I think at the heart of the problem that we wish to tackle is this trade-off between spatial and sequence context. What that means is just that, you know, here's that, like, cartoon of these different territories and how they're organized in the nucleus. Here is kind of like anybody looking at a microscope and staining the nucleus with DAPI. You see this image. And inside each one of these territories is a chromosome, and that has some primary sequence context. You know, there's 3 billion base pairs of primary sequence. And that primary sequence has many, like, regulatory elements and epigenetic marks, where the sequence— the primary sequence is really important for the function. And as I just mentioned, the structure is always also important to the function. So, how do we get this connection between the primary sequence and the structure? When we look at the nucleus in the microscope shows an image like this. And, you know, there's been this revolution in our ability to sequence DNA, as it was alluded in, you know, that's been really powerful for a lot of fields such as in ancient DNA, but, you know, just in general for molecular biology. And when we sequence DNA, what's actually happening is that— oops— we take this nucleus, which has some exquisite structure underlying it, we grind it up, and then we put it onto an Illumina sequencer. And what the Illumina sequencer is, actually, it's like a flow cell. It's like a fancy microscope that's going through and imaging. And each one of these colors going through is actually one base. So you've taken the DNA, and you've dissociated it, and you've gotten rid of all the structure. And then you're putting it back onto a microscope. What we really wanted to actually say is, can we actually just do this in situ? Can we go and look, put the sequencer in the sample, and connect the spatial and sequence context directly within your sample? And can we do it for both the genome and also the epigenome? This is actually kind of an immensely hard problem. And I'll get to you as you— through the talk and how we manage to tackle this problem. And fundamental to how we're doing this, how we're accessing both the genome and the epigenome, as we're taking advantage of a technology called ATAC-seq, which actually was developed by Jason in his graduate work. And in ATAC-seq, we take advantage of the Tn5 transposase's ability to insert sequencing adapters into open chromatin. And then when you then PCR out these fragments and amplify them and sequence them, you can get a sense of basically which parts of the chromatin are open, and basically the epigenetic status of a cell. Alternatively, you can also, it turns out, use Tn5 transposase to just sequence DNA in a context-unaware way. That's just like taking DNA and tagmenting it in your normal Nextera kit. And so, we take advantage of that, too, in our protocol. So, what do we do? So to develop this platform, we took this familiar approach of Tn5 transposition, and we modified it to work on in situ samples. And so this is kind of like a work led by Andrew Payne, Zach Cheng, and Paul Reginato. And, you know, as I mentioned, kind of a joint collaboration between many labs. So we take fixed cells or tissues, and then we actually just, like, add the Tn5 transposase into the tissue. Turns out that this, with lightly-fixed cells, this seems to work very well. You can insert the adapters directly into the genome while preserving kind of the genomic architecture. And then we take advantage, we do kind of this trick that has been around from PacBio single-molecule sequencing, which is that we ligate kind of these like circular dumbbell sequences to these adapters. And what does that let us do? It lets us kind of adorn these adapters with sequences that are helpful to us for downstream molecular biology, including kind of like rolling circle amplification. And what is rolling circle amplification? It's just that if you take a very processive polymerase and you put a primer into this kind of like handle in the dumbbell, and when you run that polymerase, it'll go around in a circle. This is actually a circular molecule. It goes around like a circular train track, and it'll make many, many copies of this piece of DNA. And these pieces, these copies kind of like are locally constrained. So, they form something we call a rollony, which is just like a locally amplified piece of DNA. And depending on basically whether we perturb the histones via a little bit of SDS or a little bit of protease, You can get an approach where you amplify the epigenome and an approach where you amplify the whole genome. Okay. So, now I'll just give you an idea, maybe this is kind of the concept of how this works, and I'll give you now an idea of what the data looks like and how we actually read it out. It turns out that the molecular biology for generating these libraries is easy. What's actually hard is going in and sequencing them in situ. So we built kind of a, our own sequencer. It's a spinning disk confocal with automated fluidics, and we're implementing kind of an old-school molecular biology sequencing chemistry called SOLID, sequencing by ligation. For the purposes of this talk, how that exactly works isn't relevant. All you need to know is that you go in and perform a series of enzymatic steps that interrogates whether a base on your DNA is either A, C, G, or T, and that's read out by one of four colors on your microscope. So, this is kind of what the data looks like. You— each one of these circles is a cell, and you can see that it's filled with these fluorescent spots. These fluorescent spots are these locally amplified pieces of DNA. And when we sequence it, these spots are one of four colors. And we will go and take many fields of view, which are each 2,048 by 2,048 pixels, and we take it in 3D. This is actually quite challenging for image processing later, but allows us to get a 3D reconstruction of the organization of the genome. We have these 4 channels representing the 4 bases, and we carry out 20 cycles of sequencing. And then here is kind of just a— This is just a quick video of what that— those 20 cycles of sequencing look like in one cell, and we do this across hundreds of cells. Now, you might say, basically, that, well, 20 bases of sequencing actually is, like, pretty hard to resolve, to map to the human genome, actually. And also, you know, the reads are really short. 20 bases is a very short read. So, you know, what we really sought out to do is we wanted to do really long paired-end reads. And we actually came up with quite a clever workaround to that, which is that we will— we use a UMI, which is just a unique molecular identifier. And we put a UMI here in this dumbbell. It's just 20 Ns. Now each molecule you ligate has a unique random set of DNA bases associated with it. And then we actually sequence this UMI in C2, these 20 bases. And then what we do is we extract the DNA from the sample, and then we put it onto one of these next-generation Illumina sequencers, which can read millions and millions of sequences up with maybe hundreds of bases of paired-end reading. And we do that by— we read With that, actually, we read— kind of using this primer, we read the genomic insert with a paired-in read. And then we also associate that on the Illumina sequencer with this UMI. And then we do a computational matching of these unique molecular identifiers that we read out on the Illumina sequencer with what we saw in C2. And this process kind of— we came up with a computational pipeline to do base calling and also do this matching. And basically what you see is that these are an example plot of how well the matching is. Basically, you know, with higher imaging quality, you get more bases which are uniquely mapped to the Illumina. This is kind of a quality of how well you uniquely map to the Illumina sequence. And compared— and then we set a threshold for false discovery by permuting all of the sequences that you get on the Illumina sequencer. And basically the takeaway is that actually we can get almost 90% of the spots that you see in situ mapped to a unique Illumina sequence on the Illumina sequencer this way. And that's actually just plotted here. These are two nuclei. And the ones that are uniquely mapped are red and green fractions. And almost all of the spots in white are red and green, with the exception of a couple of blues, which are guys that have high base calling quality, but you never— during this extraction process or during this Illumina sequencing process, you've lost them. This is actually— so this means that we actually get 90% of our reads in situ with paired-in 150-base sequences. Illumina reads. And that's something that, you know, has never been accomplished before, and this is a really big part of the platform we're trying to set up. And so, what does it actually look like when we map these paired-end illumina reads onto the genome? Well, the first thing that we immediately see is that we reconstruct chromosome territories and the broad-scale architecture of the nucleus. And so, here is that cell I showed you, and we can take it along with DAPI. So, here's that cell I showed you in DAPI, and here are all of them in C2 mapped reads. There are about 500 mapped reads in this cell. And we've actually just colored the reads by which chromosome they map to. And so— and you can immediately see that the colors cluster into these little globules. That's the chromosome territory organization, and here is actually just like a blown-up connect the dots, where like each dot is like where they are in sequence space connected to the next mapped sequence in sequence space. When we look at kind of like the pairwise distance matrix aggregated over our 100 cells, we can reconstruct kind of something that looks like a Hi-C map, where these block diagonal distances, where they're very close, is a reconstruction of the fact that you have chromosome territories. Basically, DNA which is mapped to the same chromosome are close together. You can actually already see that. And then another interesting thing you see is that actually you get kind of this off-diagonal enrichment in these smaller chromosomes. And that's actually because it turns out that, at least in this cell type, the smaller chromosomes like to hang out in the middle of the cell. And I'll show some data in a couple slides to that effect. And so, what are some cool things that we can do with this data? Well, it turns out that because the reads are long, and the fact that we get this spatial co-localization of reads that are mapped in sequence space in this spatial context, you can assign, basically, reads that you couldn't normally map to which chromosome they belong to. It turns out that large fraction— of the human genome is like unmappable— the sequence space is unmappable because of repetitive sequence or alignment to centromeres. And we can actually place those unmappable reads. They're unmappable to the genome, but you can place them in their spatial context and annotate them. And when you do that, you can reconstruct kind of the enrichment of different repetitive sequences within the genome and their localization within the nuclear architecture. And here we just kind of ran a simple statistical test to look for which one of these— what fraction— what annotations of these unmapped elements have significant radial bias within the genome— within the cell. And here is actually just kind of a heat map showing that some elements really like to prefer— and this is like radial bias from the center— some elements really like to be preferred in the center of the nucleus, and some elements are really enriched at the periphery. And this has been a little bit observed previously by people with DNA FISH, but this is kind of the first systematic way of profiling the spatial biases of these unmapped regions of the human genome. I guess. And so, what can— what does this data really allow you to do? It allows you to look at kind of chromosome organization in single cells at very different scales. We can recapitulate, as I mentioned, chromosomes into territories. And as I mentioned, there's kind of— as a function of chromosome size, there's a bias towards where they like to be localized inside the cell. We can look at these power law relationships in these polymer models of basically chromosome organization. Here we're actually just looking at the power law scaling of distance as a function— genomic distance, a spatial distance as a function of genomic distance, and looking at how that differs between across arms versus within arms. And we can construct kind of like Using these kind of physical constraints, we can construct models of how the chromosomes fold. And actually, we can infer, like, higher-order, megabase-scale folding within single cells. And we can use that to look at kind of the heterogeneity between homologs within one cell. For example, here, we're just actually showing you two homologs within one cell of chromosome 2. And they have very different structures, right? One of them is very closed, and one of them is in this loop. And we find that looking across many cells, we find that basically there's immense heterogeneity within homologs. There's no coordination. Like, cell homologs are just as dissimilar within a cell as across cells. And we're focused on applying this tool to beyond just cells to organisms and tissues. And the first thing that we're actually trying to look at is early-stage mouse embryos. And we're really interested in looking at that because there are very interesting questions related to, for example, maternal to zygotic transition and activation of the genome, as well as there's some really scant evidence, but very tantalizing, that the maternal and paternal genomes are spatially segregated, at least during the first couple stages of the embryo. And so here is actually a mouse embryo that we carried this prep through. And this is at the 4-cell stage. And you can actually see there's more than 4 DAPI-stained nuclei. That's— one of those is the polar bodies. And then just focusing on one cell— oops. Sorry. It doesn't seem to— focusing on one cell, we can— this is one base of C. Sequencing. We're actually sequencing quite a number of these embryos at the 2, 4, and 8-cell stages through development. And so building upon this platform, we're actually interested in, one, how do we sequence more spots per nucleus? And one way we're doing that is applying up-expansion microscopy and physically enlarging these cells to fit more Rallinis within each cell. We estimate that using this sort of approach, we can fit We can get maybe up down to sub-megabase resolutions within one cell for localizing genomic structures. And then the other thing is that because it's an intrinsic microscopy technique, we can overlay other sorts of modalities, including fluorescence antibody imaging or RNA imaging on top of the in situ DNA sequencing. And kind of just as a preview of the fact that we can do expansion microscopy, we actually carried out this library prep. In cells with expansion microscopy, and this is kind of the normal cell. This is a 4x expanded cell. You can see kind of the physical size of these nuclei. And then this is actually an iterated expanded sample. It's actually 16x expanded. We think that within those, we can probably fit like 120,000 amplicons. And with these tools, we really want to kind of tackle kind of these— like the underlying heterogeneity between cells and how that relates to cell function. In this talk, I mainly focused on intracellular organization of the nucleus. We're really interested in applying like multi-omics to look at like how do transcription factors relate to genome structure. And then the next step, as I kind of alluded in the embryos, is how do you move that to the intercellular context? And that's it. Thank you very much, and I'm happy to take any questions.
[APPLAUSE] We have time for a question, if there's one in the audience.
Okay.
You showed a structure with a low number of larger chromosomes at the outside, for example. Do you think that's just spatial optimization? Or do you think they're trying to get close to something or functions at the membrane and locations to do specialized stuff?
[Speaker:JOSHUA ELKINGTON] Yeah, that's a great question. I think there's definitely kind of lamin-associated domains, LADs. And I think it's a function that the bigger chromosomes are more gene-rich and the smaller chromosomes are more gene-poor. And within the cells, If you look at, like, the Hi-C compartments, there's already, like, the segregate— I didn't show the data here, but we can also look at A and B compartments in Hi-C, and there's kind of this radial segregation. So I think it's very much related to actually something like that, the fact that the gene richness really dominates this radial distribution. Okay.
Thank you so much.
More from Joshua







Scientist Stories: Hans Waterham, The value of phenotypic assays in peroxisomal disorders




Scientist Stories: Joel Zlotogora, Genetic carrier screening programs for reproductive purposes