Scientist Stories: Garry Nolan, Pioneer in Spatial Genomics
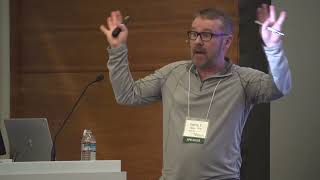
In this talk, Garry Nolan outlines the evolution and impact of high‑dimensional single‑cell protein measurement and spatial proteomics. He begins with the origins of CyTOF (mass‑cytometry) – metal‑chelated antibodies, 180 isotopes per antibody, and plasma ionization – and how this enabled 45‑50‑parameter profiling of immune cells, including perturbation experiments and downstream modeling (Citrus, connectivity, pseudotime). He then describes how unsupervised clustering and reference maps (landmark nodes, force‑directed graphs) reveal coordinated immune modules across tissues, leading to the discovery that peripheral proliferation of a memory CD4⁺ T‑cell population predicts effective tumor rejection, a finding that translates to human melanoma trials. Nolan moves to spatial proteomics, detailing the development of secondary‑ion‑mass‑spectrometry imaging (MIBI/IMC) with nanometer resolution, barcode‑based multiplexing, and applications ranging from chromatin‑level imaging to ATAC‑seq‑compatible mapping. He also presents a low‑cost cyclic imaging platform that uses DNA‑tagged antibodies to achieve 30‑50‑parameter imaging on standard microscopes. Throughout, he emphasizes analytical pipelines for module and neighborhood detection, elastic‑net based “immune clocks,” and the broader vision of using these high‑dimensional maps to infer causality in disease, from cancer to pregnancy complications. The talk concludes with a call to adopt these tools for systematic tissue‑level atlases and dynamic modeling via pseudotime.
Chapters
So I'm going to talk about pathology from the molecular scale on up, right? We all know that we're interested in such things as molecules inside of the cells. We know that when they organize in certain ways, they form cells themselves, which have different functions. They form communities. Local niches, and then of course there is the tissue itself. And we know that we could draw lines everywhere from any one of these molecules here to cells out here to how these molecules drive the formation of all of this structure. How are we for the life of ourselves going to figure all of this out? What are the means by which we can accomplish this? So what are the levels of intercellular organization that can be understood? So I've been interested in the single cell for some time. I was a grad student with Len Herzenberg back in the day when 3 parameters was the height of the multiplexing that could be accomplished. And we've seen over the succeeding 20 to 25 years with fluorescence, that number has really only reached about 15 to maybe 20 for high art labs to be able to do a high parameter protein analysis, at least. We've watched simultaneously, though, that the single-cell RNA-seq world has quickly moved into the thousands of things read per cell, but there's a lot of missing data in there as well. So I'm going to stick mostly with proteins because I think there's high-value information in those proteins, and I'll tell you about our efforts primarily in that realm. So we came across a technology originally developed actually by Scott Tanner at the University of Toronto that he called CyTOF, that he was showing would be capable, if used correctly, of being able to measure 45, 50 parameters. So we got together, his lab and mine, probably one of the best collaborations I ever had, where we showed that in fact with this technology we can get high-value data out of the immune system well above the threshold of what was accomplishable by fluorescence. Right, so what we do is we start with the cells, and we actually introduced as well the concept of doing perturbations. On the cells, especially with blood, because say blood cells or cells out of a tissue really haven't decided what it is that they're going to do. They're multipotent, right? Even when they're differentiated cells, they're capable of doing different things. So if you stimulate them in different pseudo-environments—cytokines, drugs, whatever—that would cause the signaling pathways to go down one path or direction or another, allow the intracellular states to reorganize. So we use these perturbations and then collection of the information from those perturbations to build models of how the cells are operating or thinking. At a certain time point post-activation or post-perturbation, we cross-link the cells primarily with paraformaldehyde. We then permeabilize the cell membrane. And the means by which we did this high-dimensional analysis was using metal-chelated antibodies, where the way that we got the metals or the labels onto the antibodies, we would start with the antibodies. We would have a chelator cage, which can capture a 3+ ion The 3+ ions we primarily used are isotopes from the lanthanide series down here. What's nice about that chemical series is it's very easy to make 3+ ions out of them, and there's also way more than just the 10 or 15 elements here. We have probably about 30 to 35 isotopes that are commercially available. Right, so we put these then onto a polycarbon backbone. That polycarbon backbone is attached chemically through pretty standard chemistry onto the antibody itself. And you can get about 180 or so atoms of any given isotope per antibody. Remember that number because it'll become important a little bit later on. Right, so now we have a label. We have as many as 45 different labels. We create the panels of antibodies, all validated, of course. We then make them into a single-cell droplet stream, each one of those droplets containing, let's say, a single cell. As best as we can manage. That then is sent into a 7,500-degree plasma flame. This is about pretty much the surface of the sun temperature. So as the droplet enters, the cells are atomized and ionized. Everything that once was the cell is here, all of the atoms thereof. That goes into the mass spectrometer. So there's no cell sorting here, by the way. Unless you have a Star Trek Reintegrator on the other side of this. So we have this cloud of information which is collected in a mass spectrometer where we're focusing. We throw away for the time being all of the carbon, nitrogen, etc., and we focus just with a mass filter on the metals that we have attached via the chelators. And then we're sweeping about 80,000 times per second, and these would be the sweeps, and when a cloud of ions passes that once was a cell where we're looking at the information from the individual isotopes, we can now collate that information, digitize it, and turn it into a 45-dimensional object, right? So that's the joy, and then that's where a lot of the problems begin, right? You get into all of this notion of these high-dimensional clouds of— just like Suchi was talking about, where you've got clouds of information in high-D space. Where you have to find the things that are most similar to each other, make some kind of decision as to where one cell population begins, another ends. There's a religious war around that kind of work, certainly. I'm not going to get into that. But we can automatically find and cluster— it's a different use of the word cluster— cluster those high-dimensional objects. And then we can put them into circles, right? And I'll show you some examples of that, where the circle will represent one of these clouds. And then represent them in 2D or 3D plots. So it's a way of de-dimensionalizing so mere mortals can understand the data. Right. So we've used this in a variety of different settings. And the primary, I think, message I would like you to walk away from this is that heterogeneity is an illusion. Right. If you believe that everything is heterogeneous, then you're basically saying it's chaotic. And there is no information content. And what we were basically showing with all of this work is that, in fact, there are incredible numbers, as Suchi just showed, of correlations within the data, where data is surrogates for each other, which you can use to do everything from conditional probability estimates, which will basically give you— model the intracellular pathways, to taking cells that might be from the bone marrow where you know that there's a beginning and the end a stem cell and then a most differentiated cell. And you know that all points in time in between exist. And you can automatically align cells along that trajectory to our scaffold. I'll talk about in just a moment. And where we use inference algorithms here with Citrus to basically say, well, if these are all those points in high-dimensional space or clouds of cells and we have cohorts of patients that we can regress against an outcome, we can figure out which of these cell populations is most important for predicting that. Clinical outcome. And then others as well, other ways of representing the data. Right? So that's how we've been using it, but now I'm going to talk about how we're going to— how we've been applying this to understand some of the intercellular functions in cancer and the immune system. And this basically riffs off of some work originally done by Ed Engelmann where what he was able to do was show that allogeneic Ig combined with some dendritic cell stimuli were capable of creating a systemic anti-cancer effect. So you would inject this locally into one tumor and a distal tumor would be rejected. I won't go into the mechanisms of how he thinks it operates. But obviously it wasn't done just by one cell. It coordinated a set of activities across the whole immune system that somehow led to the anti-cancer effect. So we decided to look into this with Ed and do a broad-spectrum analysis of every immune cell subset that we could reasonably get our hands on out of the mouse. So we take an untreated, ineffective therapy, effective therapy, take the tumor, break it up into the tumor cells and the immune infiltrate, lymph nodes, spleen, blood, bone marrow, on the assumption that there's information content everywhere. The tumor is doing something to more than just the local tumor environment itself. And the way that we first set up the referencing of this— this was our attempt to basically do what people do with the human genome map— is that when you've got such complex data, you want to be able to represent it uniformly in a format that is instantly understandable to the human eye. You don't want to look at 4,500 2D fax plots, right? You want to represent it as we think of the immune system. So we had a This paper in Science showing that— what we did, we set up a reference map where we would pre-gate, reference-gated by manual means with expert immunologists, supposedly, of what these cell populations were. We had unsupervised clustering approaches which would, through machine learning, go and try to find those clusters. We put then and created these as landmark nodes. We would know what those cell populations are. We put in the unsupervised nodes. We would then let a force-directed graph arrange the information where the similarity of one cell population to another brings it close to or far away from other cell populations. Right? So that creates the structure of the graph. We maintain the landmark nodes. We only use the unsupervised nodes to help create the force field of the whole map. Those landmark nodes are then used and set in a sandbox, right, so that when we come back with other data, right, that multiple different data from different times or different even animals, as it turns out you can do this in a cross-immune, cross-species approach, and you drop then the automatically clustered data into the sandbox, the cell populations that are from your experimental data will find the landmark nodes because of similarity, right, and then you can look at this and see whether things are changing. You can change the color of this according to the markers that are expressed, compare it from one time point to another to see whether things change. So that just gives you a sense of how we began this study. So there was a lot of things in the paper. This paper came out in Cell about a month ago. A lot of stories out of this. But the big first story was that during tumor rejection, there is a sustained immune proliferation in the periphery. It was actually happening out in the periphery. And that's what these red populations here mean. So that's the CHI-67 levels of expression showing that there's huge changes in these cell populations in the periphery during an effective response. Interestingly, in great contrast, very little actually going on in the tumor itself. Very little cell division. There's probably activity, but there's no cell division. The cell division is happening outside. And then probably what's happening is that that is then infiltrating into the tumor and carrying out the function. So what is it then about that? So the problem is that these maps might help, but I mean, God help us. This is nasty, right? I mean, how can we try to be able to understand what this is? And so this is actually where Suchi— thank you very much. You really introduced the idea of this— how to use variation to organize the map. So we would have for each of these time points 5 or so mice. And we would have multiple features across these mice. And we would see these reference ranges. And the reference ranges usually drive people crazy. You think of this as noise. And you take the median. It's not noise. Variation, as Suchi showed nicely, is not a feature. It's not a bug. It's a feature. That there's correlations. There are covariates within the data. That basically say that perhaps this measurement here predicts that measurement in another feature, etc., across the whole system, that there's an equation here waiting to be understood. Right? And we simply— we didn't use the fancy math at this point like what Sushi showed. We basically just used a simple Pearson's correlation, that if one thing goes up in the immune system and another thing goes up in the immune system, we're just going to draw a blue line between it. And if there's an inverted— sorry, that's an inverted relationship. One thing goes up, the other goes down. And if there's a positive correlation, we'll just draw it as red. And so these features are the nodes. In our case, the features are cell populations, and we're looking for the changes, the coordinated changes across the system. Right? So here is basically the summary of such a dataset. So you can't see it here, obviously, but all the way up that row and then all the way across this row are all the cell populations that were measured in each of the experiments. Experiments, right? And then we did a hierarchical clustering of these to say that this cell— so just to— I'll go closer. So these cell populations here, right, when this cell population goes up, that cell population goes up. When this cell population goes up, that one goes up, etc., in these modules. So very much like what people see with gene expression, right? When gene expression— genes go up and down coordinately We believe that there's some sort of guilt by association, right? And then we then believe that there must be some sort of reason for why this is going on. So what we're seeing here is really the amassing of cell-specific coordinated events across the whole immune system that are obviously probably coming together to form the anti-cancer response. Now, if I take the order that was determined here, the hierarchical cluster order that was determined here, and enforce it on the untreated or the ineffective therapy, right, you can see that the same order is not there. Right? We can see that there are some things that are similar. Let's think of these, say, as housekeeping modules, right, that they're there whether or not it's untreated or effective. These things are always states of coordination across the immune system. That are common, but that you go from this state to that state when there's only an effective therapy. That doesn't mean that in untreated that there's no order, right? I can order untreated. I can enforce a hierarchy of treat here. These are the modules of what happens in the basal immune system. But that during therapy, right, the modules reorder, right? So you're basically seeing much like what, say, signaling pathways do, where proteins come together transiently carry out the function and go off and do something else. We know that many of these proteins are parts of many pathways that come together at different times for different purposes depending upon the environment, etc. You get this reordering of the modules. First thing is what I need to think a lot about, and we haven't even come close to it. We need a new language. We need GO terms, right, for these kinds of intercellular modules, right? Are there modules, for instance, that we would always see in some sort of autoinflammatory situation? Are there just inflammatory modules that will show up no matter what the inflammation? Pulling out what these things are and understanding how one goes to the next, how you go from that order to this order under a set of circumstances, might allow us to figure out which modules need to occur causally before this happens. And we could actually use those to interfere, right? If we could interfere with the formation of certain modules, we or we might be able to intervene in the disease. Right? And this is just another example of that showing tumor eradicating, tumor delaying. Right? You can see the hint of the order with the tumor delaying therapy. But it didn't really achieve everything that was necessary here. And then an ineffective therapy in this case and the untreated were basically the same. Just to give you an example of how this operates. So, OK, how do we figure out what's most important? So what Matt Spitzer did was he basically— and I apologize for the metaphor— he basically said that the cell type with the biggest Twitter account has the most effect. Right? He basically said that the cell type that was talking to the most other cell types probably was somewhere at the center of the social network of how this was being coordinated. So he took all the cell types, ordered them connectivity, whether a positive or negative connectivity. And for those cell types that he could actually sort, sorted them, put them into a naive mouse, challenged that mouse with the cancer, and found that in fact one of those— in fact, a memory CD4-positive T cell from the periphery was capable of transferring that effect. And that was actually one of the reasons why we were able to get it into cell, because it actually broke two dogma. One of the dogmas was it was the periphery and not the tumor-infiltrating cells that was important for the anti-cancer effect, at least being able to transfer it. And the other was that, in fact, it was a CD4 cell that was doing most of the work, as it turned out. So there's various other ways to represent the T-cell data. These are all the different clouds of data that we were able to find. This was the cell populations wherein the anti-cancer effect was actually resident. And we went then and looked at human studies where we had data for similar anti-tumor therapies. And a very comparable cell population is arising. So I'm getting the sense here that what we've probably found is that this is the— at least for certain kinds of immunotherapies— that is the signature of an effective anti-cancer response, that particular CD4 memory T cell. So that's obviously very exciting. And these are from melanoma. Trials in humans. So just a quick takeaway from this: immune cells elastically compensate for their functions. This noise that we often think of can actually be found and used in a positive way to compensate. And we've used these kinds of things in pseudotimes and modules in a variety of settings now, everything from surgical trauma prediction from the blood, causal models in pathogen infection, Recently, we've just submitted one for an immune clock of pregnancy where we used a thing called constrained elastic nets where we can basically tell you how pregnant you are or how far along pregnancy you are. I know the joke, yeah. But what was interesting was that of the one patient who had a preterm labor, her clock was accelerated. So it might be that we can use this for looking for people who are at risk of preterm labor. Okay, so that's what we were able to do with cells in suspension, right, where we don't even have the information from the tissue itself. Imagine now what we could do if we can get that kind of depth of information from the tissue along with all the context, the shapes of the cells, who's next to whom, etc. So we all know that for, again, the anti-cancer effect, that there's all of these kinds of interactions schematized there. But the problem is we're still stuck in the 1950s with browner-browner as to whether or not something is positive for a given molecule. And even when we can use fluorescence, we have the disadvantage that many of the tissues are autofluorescent, right? So you have to deal with that kind of a background as well. So we, as, as was introduced, brought up a variant of CyTOF that is done for in situ using secondary ion mass spec where we use the same antibodies stained onto a tissue, right? And then this was the work of Mike Angelo. Sean developed CyTOF in my lab. They're both assistant professors in pathology now at Stanford. I wouldn't let them go. Put chains on them. And their idea was Mike's idea was to use secondary ion mass spec where you're shooting a beam of ions at the tissue. You're ablating the tissue anywhere from 1 nanometer to 10 to 150 nanometers deep, and you literally raster up and down the tissue, right, and collect the ions electromagnetically, do a mass filter, and then look at the ions that were there, the antibodies that were there, and then you recreate the tissue with pseudocolor. Over there. So this is the first of the instruments that we developed for this. It looks like something out of a James Bond film, right? And so here's the oxygen dual plasmatron. That sounds like something out of a Woody Allen film, if you're old enough to remember that one, right? And then the liquid metal ion gun, which is what lets us get down to the ultra-high resolution of what's capable. This is the instrument that has just landed in California, not by a flying saucer. It just got shipped from where we had it made, and this is what's going into my lab. This is the second-generation one. So the resolution: 5 nanometers deep, 20 nanometers wide, to 10 microns if we want. We can vary that dynamically. When we get down to the super-resolution scale, we can do thousands of channels. I'll show you how. And remember how I told you to remember that number, 180 isotopes per antibody? So this kind of mass spec is anywhere from 1 to 5% ion efficient. So if I have 180 ions, I'm basically overreading it, meaning that I've got single molecule sensitivity here, right, and great dynamic range. So tissue biopsy stained with the antibodies, primary ion gun to raster the tissue, time of flight. And then reconstruct the image. This is just an early low-res scan. So the platter is about this big. We can put tissue microarrays and tissues themselves, point-and-click navigation. The system can be rapidly scanned with secondary ion— with secondary electron ion, so we know where the tissue is, create a mask, and that way the computer knows exactly where to look. For what we're interested in. Here's just a set of the antibodies that we've already validated for this. And you can see amongst this all the kinds of high-value targets that are interested— that we're interested in for immunotherapy. We validate all of the antibodies, obviously, by co-expression, right, or anti-expression. You know, CD4 should never be where CD8 is, right? FOXP3 and LAG-3 should be non-coexpressing. And so again, the sensitivity of this instrument allows us to go into the FFPE tissues, right, where one has to basically reconcile the fact that often you don't have great antigen reconstitution because of the FFPE tissue. It allowed us to make a kind of one-size-fits-all antigen reconstitution and then come in with antibodies. And because we really don't care that much about whether we're getting perfect antigen reconstitution— epitope reconstitution because we're basically so sensitive. And so these are just giving you some idea of some of the kinds of images that we're able to create. And these are now 40— 30 to 40 parameter images, highly quantitative. And that's the same image, but now we're just looking at the rare cells, in this case, mast cells. Here's a study that Mike has been doing with Genentech. With a number of their tissues, PD-L1 expression, where in this case the PD-L1 is in the tumor. In this case, the PD-L1 is actually mostly being expressed in the immune system itself, not in the tumor bed. And red is the PD-L1. You can see the scattering. And interestingly, most of what you see in here is the tumor. But you can see some of the cells are PD-L1 positive. Others are not, sitting right next to each other. Oops. Oh, phew. And then we can see where the CD8 cells are in the tumor, right? All of the kinds of deep data dive that you want to be able to do. And this data is fresh. I mean, it's probably no more than about a month old. So we're still dealing with how to extract value out of this. Obviously, with the larger the cohort that we get, we'll be able to start to infer something about the presence or absence or neighborhoods, as you'll see, that are important. I won't go— I won't bore you with all the immune details of this. But especially just look at this one here, the indoleamine-2,3— this is the IDO gene that's basically a metabolic marker. And you can see the differences in the tumor types and trying to understand what all of this means when previously you were only able to do 2 or 3. Or so at a time. So, but that's for the tumor. But remember I said that this can get down to about 20 to 50 nanometer resolution. So I'm particularly interested in chromatin, right? And so the idea being that if we can make antibodies against all of the epigenetic marks of interest, and if that represents— those circles represent the clouds of ions that are basically where the antibodies are. Right, and that's a 20-nanometer or so scale set of voxels. If we can read through the whole nucleus of the whole cell, we should be able to position every single molecule in the cell 20 or 30 or 50, or as you'll see, hundreds at a time. 8 billion voxels. So how do we get to hundreds of parameters? So if my box is 100 nanometers, I can't really determine the difference between where those for antibodies are positioned. Obviously, at 20 nanometers or so, I can. At 20 nanometers, I can also use barcodes. Right? So with the use of barcodes, I can extend well beyond the limit of the isotopes or tags that I have available. I can play all kinds of games with the ratios and the presence or absence. I can create error-correcting barcodes, et cetera. Can we do it? Yes. So this is now actually just looking at P31. This is the natural phosphorus in the backbone of the DNA. And so the color scale here is green being a lot, just cut it off here, and then red. All the color there is phosphorus in the nucleus. It's just the density, basically, is where it's green. And what we're doing is we're basically slicing down through, ablating layer by layer of the nucleus. There's basically the MRI of all of the— of the scanning through, right? And now you can layer it. And we haven't even begun any of the mathematical resolving things that we can do with this, like people do with confocal, right? And once we do that, you'll go from a blurry image like this to, I think, much more resolved. So you— we can already, though, trace out the chromatin domains. And on the left here, what you saw spinning was where we actually labeled with the— with bromodeoxyuridine, and what you're seeing then are the replication forks. We're going to be able to label on top of that all the epigenetic marks now, DNA damage marks, et cetera, et cetera, looking at multiple— at populations of cells and watching chromatin move. We'll use pseudo-time, obviously, to infer the in-between points across that, but you can see pretty much what's coming. And we've been able, as well, to adapt this to ATAC-seq. Where we'll take the ATAC-seq transposase and we'll label it with a fluorinated oligo, and then all these green spaces here that you see— red is the chromatin and green is where the ATAC-seq has landed. Okay. So I'm actually going to skip over this and just get to the last quick bit here. That if you don't have $1.5 million burning a hole in your pocket to buy what I just I showed you, we have a $30,000 version here that will adapt to any antibody, any fluorescence scope with a little bit of biochemistry to turn it into a 50-parameter instrument. And the way that we do it is we stain again with all the antibodies at once, cross-link. We have DNA tags on each of those pieces of antibody which allow us to basically read the antibodies. Right? We reveal a couple, we image anywhere from 2 to 5, remove those, reveal the next 2. Here's basically a 41-parameter analysis in 30 hours of a 1-centimeter square, 12 Z-sections done. And again, this obviously is something that we're scaling up as fast as possible to get out to as many people as we can. Can. So human tonsil. So this kind of an image, we can go right down to the cellular scale, right, with the measurements and the shapes of everything, right? And there's just some pretty pictures of all the kinds of markers that we've been validating. And then here's tonsil germinal centers again, multiple different views of them with different markers. So the problem is those are all pretty pictures. Now we got to start doing math with it. Cell context, who's near whom, what does it mean to be near whom. So the first thing that we did was create algorithms that looks at the marker expressions and then automatically infers what the cell type is based on a list of standards, right? And this is— in this case, this is normal BALB/c versus lupus in a mouse. And you can see that the tissue organization obviously is different and there's even a presence of a cell type here, which is only found in the disease state. And this mapping system allows us to go back to the original image if we want. And then these are some novel cells. And so then what we do is, once we've automatically mapped this, now we start looking for motifs. We say, okay, here's a— here's a cell. What's the likelihood of other kinds of cells being near it? So we take a— create a master list of all the kinds of neighborhoods that might exist. And see how many places around the organ they actually do exist, right? Create these neighborhood maps, right, and say healthy biopsies, right? And then compare it to lupus, where we can see that all kinds of new disease-specific neighborhoods have occurred, right? And we now— we can go in and look at those neighborhoods, see how they're scattered across the tissue, and things that nobody has seen in the literature before. And then interestingly, neighborhoods that are found in healthy but are missing here. And again, think about that idea I told you before where if we took time points between healthy and disease, multiple time points, we could watch the neighborhoods form and figure out which of those neighborhoods might be best to target. And then all of those individual neighborhoods that I just told you we found, we can now do neighborhoods of neighborhoods, right? The hierarchy of the neighborhoods and how the tissue is organized. And those are all the hundreds of neighborhoods that were found in the spleen. And then you can say, well, where are the— what neighborhoods do B cells belong to? Where are the marginal zone neighborhoods, right? How often do they interact with T cells, etc., right? So there's a basically a universe of mineable opportunity here to understand the tissue organization in an automated way and basically finding niches And then we're going to be able to correlate the niches and all the things that I just showed you with those correlation maps. Heterogeneity is an illusion. Right? And then just— that's just our beginnings of the maps. So no, I'm not going to talk about this. Jump to the end. So hopefully what I've convinced you of is that there's modules and neighborhoods and there's value. In collecting this information. Everything that I told you we could do with SciToF, we can do right down to the molecular scale, right inside of the cell. All superstructural elements, whether you're talking about virus assembly or the epigenetics, is going to be now amenable to these kinds of approaches. And then using all of these kinds of mathematical tools, we'll be able to basically figure out the causality root that is in disease or whatever biological system is of interest. And, you know, although we can use simple correlation analysis, as Suchi showed, there's other more advanced approaches that you can use. And I'm— what I want you to do is pay attention to this. Those 4 or 5 mice that you did with the data that you collected, you can find these modules, right? Even if you used fluorescence, you can go back and mine this data. Right, and neighborhoods as well, another level of organization. So Mike Angelo, I showed you the work that he's been doing as a setup to get our MIBIs up and running at Stanford, and then my lab here, and I've spoken about with the names on the individual slides, and thanking our funders. Thank you very much. Lee, please. So, Gary, how do you plan to do dynamics? I think that is really important. I have a little trouble seeing how you're going to do that. Can you repeat the question? So the question was, how are we going to do dynamics? So that's where we do— where we use pseudotime, right? That what you make the assumption is that if you collect enough information, not every cell that you're looking at or every organ that you're looking at is in the exact same position in time. They're all slightly askew, right? And if you collect enough of them from time point 1 versus time point 2, those will overlap, right? The time point 1 and time point 2 elements overlap, and you use the most likely inference, right, the most likely direction or trajectory through that to basically model dynamics. That's the way we do it. And that's what we did on a Cell paper and that Nature paper for dedifferentiation or forward differentiation of B cells. Okay. I propose— oh, so you have one last quick question and then further questions at the panel session, please. So in your neighborhoods and all your connections, in what specific What space? Yeah, that's not physical space, right? No, no, that's just nearest neighbor space. It's similar. Well, again, I'm gonna lean on Suchi. It's sort of a valueless space. We don't know how to value the closeness or distance and what that means, and that's yet to be really— So essentially a similarity of their profiles. Yes. Okay. Yes. Thank you. Yes. Okay. Thank you. Okay.
More from Joshua







Scientist Stories: Hans Waterham, The value of phenotypic assays in peroxisomal disorders




Scientist Stories: Joel Zlotogora, Genetic carrier screening programs for reproductive purposes