Scientist Stories: Lidija Malic, Microfluidics for Molecular Diagnostics
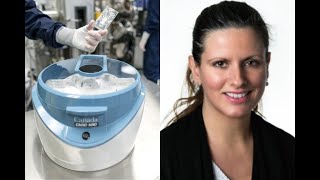
Dr. Lidija Malic describes microfluidic chips that automate blood sample preparation and run a digital droplet PCR test to identify immune cell types by DNA methylation. Her pneumatic centrifugal platform extracts nucleic acids in 30 minutes and detects CD3 and FOXP3 methylation with higher precision than standard qPCR, especially for rare targets.
Chapters
Good afternoon everyone, and thank you for joining us for this week's Bioengineering and Biomedical Engineering Research Seminar, Microfluidics for Molecular Diagnostics. It is my pleasure to introduce this week's speaker, Dr. Lydia Malik. Lydia Malik is a research officer leading the Precision Diagnostics team at the Bioanalytical Micro/Nano Devices Section, Life Sciences Division of the National Research Council of Canada. She also holds an adjunct professorship at the Biomedical Engineering Department at McGill University. Her research is focused on the development of electrowetting, centrifugal, and pressure-driven microfluidic devices in polymer materials for applications in medical diagnosis, food and water safety, single-cell analytics, and space-related applications. Lydia holds a PhD from the Department of Biomedical Engineering from McGill University and an MBA from the John Molson School of Business in Montreal, Canada. Please join me in welcoming Dr. Lidia Malik.
Thank you very much for the nice introduction. I'm very happy to be here. I was here actually a few months ago presenting for my adjunct professorship position. Today, the presentation is going to be a little bit different. I will present to you some specific works that we are doing Integrating Microfluidics for Molecular Diagnostic Applications. So this is the outline of my talk. I will briefly introduce to you molecular diagnostics and how lab-on-chip microfluidic devices can play a role. Then I will present to you some of the low-cost fabrication processes that we use in our labs in order to manufacture microfluidic devices. And I will go on to specific examples of sample preparation technologies using microfluidics for molecular diagnostics. And methylation-specific digital droplet PCR, which is actually used as a diagnostic device. And I will finally conclude my talk with some final remarks. So global molecular diagnostic market is a fairly large industry and is projected to grow. In the year 2025, it's projected to reach close to $14 billion. During the last decade, molecular diagnostic market has been primarily driven by infectious diseases and oncology, histology, and blood screening. And also, people are more aware of the personalized medicine and they are more adoptive of technologies. So technological advances in molecular diagnostics are driving the growth in this market space. So I'm sure that you have heard all about the coronavirus, that recently outbroke in China and now there's epidemic around the world. So this is just to show you how molecular diagnostics is very fast from the onset of the disease to the actual detection technologies being employed. So the first case of the virus was reported in Wuhan, China at the end of December. Within the few weeks, all the academic and research communities around the world started pressuring China in order to release the genomic data to help detect the virus and stop the spreading of the virus. So within a day, China released a novel coronavirus database with the genomic sequence. And on January 24th, just that same day, the CDC released all the primers and probes that are necessary in order to use PCR to detect the virus. And then just a few days later, IDT— I don't know if some of you are ordering your products from them— IDT is a company that sells nucleic acids. They are already starting to market the reagents that are used to detect the coronavirus. So everybody, all the researchers like you and myself, we can purchase these reagents and do the detection in our labs. So I'm expecting in the next month or two there's going to be a huge surge in the number of papers that are going to come out in this field. So this is just showing you how the advances in this technology are allowing a seamless transfer and a very fast market penetration. An issue, however, is that most of the molecular diagnostics is still performed in the central labs with very specialized equipment and highly trained personnel that uses this equipment. A lot of work is still manual, and it can be very time-consuming. So the idea is basically to integrate and miniaturize some of these processes and automate them using lab-on-chip devices. So what is microfluidics? Microfluidics is basically the power behind the lab-on-chip devices, and it's an intersection of several different fields including biotechnology and microtechnology, physics, biochemistry, in order for us to understand the fluid behavior on a microscale and then use this understanding in order to control fluid that's constrained to channels on a submicron scale. So we have many different microfluidic devices that we have developed in our labs over the past decade. We are using, for example, electrowetting on dielectric with an array of electrodes in order to generate the droplets, move them around, mix, and perform all kinds of different functions. We are also using emulsion microfluidics where we can discretize the droplet by flowing aqueous phase with an oil phase and generate a number of droplets and compartments in order to study, for example, cells on a single-cell level. We are also using centrifugal microfluidics. We are using living microsystems, and we are integrating these in a highly multiplexed 96-well plate technologies. There are many advantages of using microfluidics in order to manipulate the fluid and perform bioassays. For example, microfluidics gives some new phenomena, and we can then exploit these new phenomena in order to implement novel functions that were not previously available on a macroscale. Also, microfluidics deals with very small volumes, so we can minimize the reagents that we use and also precious samples. It allows us to perform our assays very rapidly, to integrate many different functions into a single chip in order to achieve automation. So there is a real opportunity for lab-on-chip devices in the area of molecular diagnostics, especially for some key application areas including pharmaceutical and life science research, point-of-care diagnostics. As well as veterinary and agricultural testing. In order to parallel this field a little bit with the electronics industry, in order to achieve adoption of the microfluidic devices in the field of molecular diagnostic, we have to find the right materials that can match the advanced manufacturing and industrially scalable manufacturing processes, and as well as establish certain standards while allowing customization of the technology to match the specific application. So now this is an example of a microfluidic molecular device. It is actually a Quebec success story that's coming out from GenePoc. So GenePoc developed a microfluidic platform called RivoGene, and it's a fully automated instrument that's capable of using clinical samples and doing then all the necessary steps steps in order to perform molecular diagnostic assay that's based on the real-time PCR. This microfluidic platform came out of a decade-long collaboration between NRC, Laval University Infectious Disease Research Center and Professor Bergeron, also University of California Irvine with Professor Marc Madoux, with the support of Genome Canada, Genome Québec and NIH. So what is interesting about this platform is that since it uses clinical samples, all of their microfluidic components need to be fully disposable. So they are fabricating their microfluidic devices in plastics. And as we transition basically the microfluidic research from academic labs, we must increasingly start thinking about the scalability of the manufacturing process. So in our labs, what we use are hard thermoplastic polymers and soft thermoplastic elastomers that are— that can be formed thermally using industrially scalable processes in order to produce microfluidic devices. So the advantage of using these thermoplastics is that they are relatively low in cost, they are manufacturable, so they can be single-use and disposable devices, Also, they are transparent and exhibit low autofluorescence, so they are compatible with many optical detection technologies. And they are also biocompatible and allow very easy bonding of the microfluidic devices in order to unclose the channels using simple thermal bonding. So, the processes that we use in our labs in order to form these microfluidic— to form these and fabricate microfluidic devices range from nanoimprint lithography, hot embossing— we have both automated and manual hot embossers in our labs— and finally injection molding for the industrially scalable processes. And we can then use these technologies and tools in order to fabricate different micro and nanostructures. So we use nanostructures mostly for sensors such as surface plasmon resonance and Raman spectroscopy. Spectroscopy, and we can fabricate the features in the micron size that are high aspect ratio to isolate biological entities such as bacteria or cells. We are also using soft thermoplastic elastomers in order to fabricate different microfluidic functions, including valves and pumps that are then used in a complex circuitry in order to perform many different advanced functions. So our activities in our labs are centered around our capability to process and fabricate microfluidic devices in low-cost thermoplastic polymers, and we can do the fabrication starting from the early ages of research and development to the prototyping phase and finally to an industrially translatable phase. We fabricate many different devices on the scale from tens of nanometers all the way to a few tens of centimeters. And we also have an in-house instrumentation team that is capable of making prototype instruments that allow us to test the devices that we fabricate and validate these devices on a prototyping scale. So one of the recent instruments that we have been working on in the past couple of years are based on centrifugal microfluidics. And this is the platform. It's a pneumatic centrifugal platform that is a compact benchtop instrument. It contains a pump and pressure sensors that allow us to apply pressure to the microfluidic device while in rotation. It also contains a computer with custom control software, and it has 8 pneumatic lines that are interfaced to the cartridge using using a manifold. The manifold itself contains 4 thermoelectric temperature cycling zones that allow us to do, for example, thermal lysis of the cells or PCR amplification using thermal cycling. And this is an example of the microfluidic cartridge that is integrated with the platform. So the platform itself works by rotating the chip using a rotor and applying the pressure sensors. And you can see here, this is the chip. It can rotate. We can apply the pressures on each of the ports, and then we can drive the liquid not only as in regular microfluidic devices where the liquid goes only from the center of rotation towards the edge of the device, but we can actually move the liquid from the edge of the device back to the center in order to integrate many different functions. The advantages of this pneumatic microfluidic application is that we can move the complexity from the chip to the platform. By doing this, we can design very simple cartridges that have very low tolerance— very high tolerance to the manufacturing errors, so we can use very low-cost fabrication processes in order to fabricate the devices. Also, the movement of the liquid is completely independent of the surface properties, so we can use many different materials to fabricate the device. So these are the examples. We can integrate many different microfluidic functions. For example, we can do downstream liquid transfer through a siphon valve. We can do dispensing of very small aliquots from a large volume. We can do inward pumping, so we can move the liquid from the edge of the chip towards the center of rotation. And we can also perform very rapid bubble-based mixing. So those of you who work in the microfluidics field, you know that the mixing on a microscale is very difficult because the flows are laminar. In this In this case, we can, by applying the pressure, we can enter the air inside the microfluidic device, which enables us to mix the two liquids within a second. Having a bit of trouble. Okay. So we have used this centrifugal microfluidic platform for many different applications, and one particular application is for sample preparation for molecular diagnostics. For molecular diagnostics, sample preparation is an important prerequisite, especially if you're dealing with liquid biopsies such as blood. We want to fractionate the blood into its components, and in order to do this, usually very laborious procedures are done using commercially available kits in order to, for example, extract the DNA or proteins. In our case, we are using the platform for fractionation of the blood, extraction of the plasma, for protein immunoprecipitation, and also for nucleic acid extraction. And this is an example cartridge that we use for nucleic acid extraction. So this video shows we are taking the blood that's contained in an external vial and we are moving it into a chamber where we're mixing it with the lysis buffer, and then we are passing the lysis buffer onto the chamber that is located right above the heater in order to perform the thermolysis. After we thermolyze the blood, we can then pass it through the chamber that contains a small capture filter that's basically silica filter or silica beads. And we pass it several times in order to capture all the nucleic acid. After that, we wash many times in order to remove all the impurities that may have bound to the capture matrix. And after all the washing, we can then extract or elute the nucleic acid from the capture matrix into the chamber that is on the chip and then off to an external vial that can be used for processing, downstream processing. And as you can see from our results, we obtain very good nucleic acid extraction yields compared to commercially available kits with very low variability. And this is because the whole process is done automatically. So usually when you do manually— manual extraction, sometimes you can— if your pipette is not well calibrated, you will have some errors in the volume that you do. But by having all this implemented on the microfluidic chip in an automated fashion, you eliminate this error. Also, the purity of the nucleic acid is very good, so it can be used directly in the molecular detection techniques. So the isolated pure nucleic acid can then be used in a variety of assays, and these are some of the examples of molecular diagnostic assays that you can use. For example, to diagnose clinically infectious diseases, to do the blood donor screening, to do many different genomic analysis. And one of the next-generation molecular diagnostics deals with epigenetic signatures of the nucleic acids as biomarkers for various diseases including cancer, immune system disorders, and neurological disorders. And my talk is going to be mostly centered— or the example that I'm going to give you is going to be mostly centered on the epigenetic markers. So just a small refresher on what is epigenetics. So we all have in each of ourselves around 6 feet of the DNA, and in order to accommodate this DNA, the DNA winds itself around histones, which are basically the clusters of proteins. And on top of our genome, there are small chemical tags such as DNA methyl groups. Or DNA methylation, which govern the winding of the chromatin. So if the chromatin is tightly wound, then the genes are not visible to the cell and they're essentially switched off. But if they're a little bit more spread apart, then the gene is visible to the cell and it tells the cell what to do based on these epigenetic tags. So one of the most widely studied epigenetic mechanisms is the DNA methylation. So DNA methylation is a type of chemical modification of the DNA which involves the addition of a methyl group to the number 5 carbon of the cytosine in order to convert it to the 5-methyl cytosine. And in humans, the DNA methylation occurs in cytosines that precede guanines, so-called de-nucleotide CpGs. DNA methylation profiles using genome-wide methylation studies have been found that they are specific to the cell or specific to the tissue, and they are called tissue-dependent differentially methylated regions. Now, each cell type possesses a unique pattern of the DNA methylation, and since this is the is the case, then we can use these differential methylation studies in order to delineate different cell types. This is usually done using methylation genome-wide profiling methods such as bisulfite sequencing and Illumina methylation assays, which quantifies the methylation levels at specific loci within the genome. And they're suitable for studying the biological role of the DNA in both normal and diseased cells. So I'm showing you here the map of specific tissue-specific DNA methylation. In one example, you can see that the methylation profile is different between different tissues—lung, brain, liver, muscle, and colon. And on your right-hand side, then these specific methylation profiles can be used as markers in order to, for example, determine circulating— the provenance of the circulating free DNA that is taken from a blood biopsy. And as you can see here, the DNA that's taken from a blood biopsy is also using bisulfide sequences plotted in this differentially methylated map. And then you can use this map in order to quantify exactly which cell comes from where and how many of the cells you had in your original sample. In our case, we are also using epigenetic profiles in order to deconvolute cellular composition in the whole blood, and specifically we're looking at differential leukocyte subtyping. So in the blood, you have many different leukocytes. For example, you have CD3+ T cells are the regulatory T cells, and you have other immune cell subsets. So in order for us to be able to determine how many CD3+ T cells and the regulatory T cells in the body we have, we are using two different gene promoter regions, the CD3Z and the FOXP3 gene promoter regions, which are demethylated in the regulatory T cells, but they are heavily methylated in all the other cells. So By looking or by detecting these methylation regions, we can measure, we can obtain leukocyte composition. So this can be done using qPCR, quantitative methylation-specific PCR. And how it works, basically you would take your sample that contains both the unmethylated and methylated targets, you would subject it to the bisulfite treatment. Bisulfite treatment, what it does, it converts the unmethylated cytosines to uracils and the methylated remain unchanged. And then after that, you include all the probes and primers, both unmethylated and methylated, in order to perform the amplification, which will then allow you the detection of the proportion of the unmethylated and methylated targets. The strengths of the quantitative PCR is that it's widely accessible. It's also used in clinics. Also, it provides a variety of detection chemistry, which gives it some flexibility. It has a relatively large dynamic range and high throughput, which renders the technology compatible with automation. Some of the disadvantages of the technology, or shortcomings, is that the technology itself is not an absolute measurement. It provides you with a relative measurement. Subjective measurements, so you need to, with every measurement that you do, you need to include standard curve calibration. It also has lower precision and it's less reproducible when you have very low input target concentration or rare targets as well. And it also has a lower precision for higher copy number variation analysis. An alternative technology to the qPCR that has emerged within the last decade is digital digital droplet PCR. So digital droplet PCR, what it does, it basically uses water and oil emulsions in order to encapsulate and partition your sample into tens of thousands of droplets that are sub-nanoliter in volume. And then the PCR amplification is carried out within each individual droplet. So each individual droplet contains all the primers and probes that are necessary to perform the amplification itself. After PCR, we measured the fluorescence intensity in each of the droplets, and then we count the number of positive droplets, which gives us an absolute count of the copy numbers that we had in our original sample. And this is a typical workflow of the ddPCR. So first you emulsify your sample. After that, you run the PCR amplification using a thermal cycler. Following that, you array your droplets. You either array them in an imaging channel and you do fluorescence imaging, or you pass your droplets in a manner similar to FACS, where each of the droplet's intensity is measured using a photomultiplier tube, for example. And finally, after counting all the positive droplets, then you fit the data using Poisson distribution in order to obtain the copies of the target that you had in the original sample, as well as the concentration. There are several advantages of the droplet PCR over the conventional qPCR methods. It's an endpoint measurement, and as the amplification is done in each droplet, you can only count positive droplets in order to obtain absolute quantification without the requirement to run a standard curve. Also, it is more precise, it's more sensitive. And it's a more reproducible method to use. So in order for us to subtype white blood cells, this is the assay that we have designed for our methylation-specific ddPCR. So we start with about 100 microliters of the blood, whole blood, which we then lyse and do DNA extraction either using manual extraction kits or using the microfluidic device that I have shown you previously. Following the DNA extraction, we do a bisulfite conversion where the cytosines, unmethylated cytosines, are converted to uracils and the methylated ones remain unchanged. After that, we mix our sample with a PCR mix that we have prepared. The PCR mix contains all the primers and the probes that are specific to the 3 genes genes that we are looking at. So we are looking at the CD3Z gene, which can be correlated to the CD3+ T cells. We are also looking at the FOXP3 gene, which is correlated to the regulatory T cells. And we are also including a gene that doesn't contain any cytosines, and this gene is therefore immune to the bisulfite treatment. And we use it in order to count the total number of cells so that we can, at the end of our assay, we can obtain the proportion of the cells that we are looking for. After we prepare our PCR mix, we emulsify it, so we generate the droplets out of it by flowing it using a droplet generator device. We then run the thermal cycling protocol, and finally we read the droplets by inserting them in a microfluidic device in a monolayer fashion, and we take fluorescence imaging. And by measuring the intensity of the fluorescence of each of the images, we can obtain these fluorescent maps. So, the first step in our protocol is the microfluidic droplet generator device. So, the microfluidic droplet generation device is fabricated from a thermoplastic elastomer, which is industrially known as Mediprem, in the form of a double-layer stack using hot embossing. The advantages of having device that is homogeneous, that has both the microchannels and the sealant of the same material, is that all the channel walls are— have the same surface properties. And since Medipren is hydrophobic, we don't need to do any surface treatment in order to do droplet emulsification, which is in contrast to some of the materials that have partially hydrophilic surface, such as glass PDMS chips. Medipran material is also optically clear. It has a relatively low fluorescence background over a wide spectral range, which is useful for potential integration of a complete sample-to-answer protocol using ddPCR. So, this is the setup that is typically used for droplet microfluidic devices. The droplet size can be easily adjusted by changing the flow rates on the syringe pumps that are connected to the microfluidic device using tubing. And we can generate the droplets that are— with one single device that has the junction area of 50 microns, we can generate the droplets in the range of 30 to 150 microns with extremely low coefficient of variation. So in ddPCR, low coefficient of variation and precise determination of the droplet size is extremely important because any variation in the droplet diameter can underestimate the number of positive droplets and can introduce the errors in the quantification itself. So for us, we are able to control the droplet size just by applying different flow rates using our syringe pumps. During our experiments also, we empirically find that there is a trade-off between the droplet size that is required in order to get efficient amplification of all targets and the stability during thermal cycling. So if the droplets are very large, once you start your thermal cycling protocol and heating to 95 degrees, all the droplets will coalesce and merge. If they are too large. If the droplets are very small, then your amplification will suffer because you will not have sufficient material in all of your droplets in order to have amplification, which can also introduce error. So for us, we found that the optimum droplet size was between 65 to 100 micron range. So as a compromise, we chose droplets of about 72 microns. So in addition to the droplet size, we also optimized the PCR buffer composition. We found that aqueous phase components are very important as they also play a role in the interfacial tension. And especially the quantity of the polymerase and the glycerol were critical in order for us to maintain droplet stability during thermal cycling. Also, the fluorosurfactant concentration that is used in the oil in order to maintain stability of the droplets was higher than that for applications that don't require any thermal cycling. So for applications that are performed at room temperature, your typical fluorosurfactant concentration will be between 1% and 2%. In our case, it was quite high. It was 5%. And finally, we found that merging of the droplets So the oil itself has a very high oxygen content, and we found that if we heat our droplets very rapidly, the oxygen starts to get released from the oil, and that creates disturbance and causes the droplets to coalesce. So in order for us to prevent the droplet coalescence, we have included a ramp rate in our amplification or thermal cycling protocol. Following the thermal cycling, we image the droplets. We array them in the microfluidic channel in order to have a monolayer, and then we image them using the fluorescence microscope. And then using a pipeline that's implemented in an open-source software, CellProfiler— you may have used it for your cell analysis— what we do, we measure the intensity of each of the droplets, and we plot the intensity of the droplets in this intensity map. And then we count the positive droplets. But how do we determine what— which droplets are positive and which are negative when we have a lot of droplets that are intermediate in between the two clusters? And these intermediate droplets are called rain, and they are often the cause of inaccuracies in your quantification data. So in order to reduce these inaccuracies, what we have used is to define the rain algorithm. So this algorithm basically defines the two clusters, the positive and the negative cluster, and then the positives are set as within the 3 standard deviation of the positive mean. And the threshold is then set such that the rain itself is only less than 1% of the positives. And this allowed us to minimize these inaccuracies. So you can see this is an example of the multiplex ddPCR scatter plots and the droplet counts. So we have counted the CLAS, which represents total leukocytes count. We counted the CD3Z, which represents the CD3+ T cells, and as well FOXP3, which represents the regulatory T cells. And after the count, we have taken the data, we have fitted it with Poisson distribution, which then gives us how many target molecules we have per each droplet. And this in turn gives us the copies per droplet for each of the 3 genes, and we can calculate then the proportions of the cells by dividing the copies per droplet of the CD3 sets with the copies per droplet of the C less or the total leukocytes. And the same is done for the regulatory T cells through the FoxP3. Xp3. So in order to validate the ddPCR for accuracy, to see how accurate we actually are, what we have done is we have— we know how many— how much DNA we have in each of the cells. And then by assuming the droplet size of about 75 microns, we take the appropriate amount of the DNA, which will give us a theoretical— theoretically calculated copies per droplet number of about 0.5. We perform our protocol and we empirically obtain the CPD value. And you can see here, we do this for a CELES gene for the total DNA or total leukocyte count. And we obtain for both, we use the samples, PBMC samples which we commercially obtain, and we also use whole blood samples. And for both of the samples, we obtained CPDs that are very close to the theoretical value, which demonstrates that ddPCR is highly sensitive and specific and can be used, therefore, for specific cell counts. We also use immunofluorescence measurements in order to benchmark all of our molecular detection methods. So for the immunofluorescence, what we do, we stained all all the cells with DAPI, which gives us our total number of cells. And we stain the CD3+ T cells with the CD3 antibody and the regulatory T cells with the CD4+ and CD25+ antibody. And these are the results of our ddPCR assay, which are compared against the qPCR as well as immunostaining. So we found we found for the whole blood sample for both genes, for the CD3+ T cell counts and also the regulatory T cells, we found that the digital droplet PCR correlates much more closely with the immunofluorescence measurement in comparison to the qPCR method. This was especially true for the low copy number gene FOXP3, and as you can see from the qPCR data that we obtained for the FoxP3, the cycle, the amplification cycle, the threshold cycle is very late, which can introduce very large errors in the measurement itself. So digital droplet PCR, if you have very low target amounts, is definitely the way to go for molecular diagnosis. Now, our ongoing work is focused towards the integration of the digital droplet PCR into a single device. The current state of the art that's marketed by Bio-Rad, and also what I have shown you in, in the previous slides, requires 3 different instruments. One instrument is used for the emulsification, another instrument is used for thermal cycling, and then another instrument is used to actually read the droplets. What we want is a single instrument because these 3 instruments still require a lot of manual manipulation in between and still require highly trained personnel in order to perform. So the vision is to go to a single device, single instrument. And toward this goal, what we have been working on is developing digital droplet PCR on our centrifugal platform. So how the cartridge works: from an external vial, we have the DNA that we transfer on the chip into our PCR mix, and then the PCR mix is emulsified by rotating the platform. The liquid passes through this reservoir number 1 into the second reservoir. The droplets are generated. Once the droplets are fully generated, we can then perform the thermal cycling, and finally after the thermal cycling, we can move the droplets to a chamber that we can actually read optically. So this is an example of a centrifugal microfluidic emulsification device that we have fabricated in our labs. What we wanted to assess here is what kind of size distribution in the droplets we can obtain. So we have many different nozzle types and sizes in order to do this work. And we have performed several experiments that are investigating how the nozzle nozzle width, as well as the centrifugation speed affect the droplet size. Because we need for the ddPCR, as I have mentioned earlier, a specific droplet size in order to be able to perform the thermal cycling without merging of the droplets. So we have found that the droplet size of about 70 to 100 micron can be performed by rotating at 800 RPM and having nozzle nozzle widths between 10 to 30 microns. The droplets that we obtained also with the platform are highly monodispersed, and the coefficient of variation is even less than 1, which is within the error of the measurement itself. Also, our preliminary results show that we can do the thermal cycling on the microfluidic device on the platform itself automatically without merging of the droplets, and we are able, we've been able to show, these are just new results, to show that we can amplify, we can perform a singleplex reaction, we can amplify the CLS gene target successfully. So there is a lot of potential for using digital droplet PCR for molecular diagnosis, especially for this next-generation molecular diagnostic method that's based on the DNA methylation biomarkers. In addition to different cell subtyping like I have shown for the leukocyte subtyping for hematological diagnosis, there are also— there's a tremendous translational potential of the epigenetic alteration to be used as biomarkers for prediction, diagnosis, as well as prognosis to response or even treatment to disease that that is used in either— that is currently used in clinical routine or under testing in clinical trials. And which technique, whether you're going to use genome-wide or quantitative approaches such as digital droplet PCR, will depend on the tissue sample. So whether it's the tissue solid or whether it's a liquid biopsy such as blood. And the quantitative approaches such as ddPCR are especially suitable for liquid biopsies such as blood. So we have also used the technology for other application areas in addition to DNA methylation studies. We have used highly multiplex digital droplet PCR for bacterial genotyping. We have done this project in collaboration with Canadian Space Agency in order to genotype bacteria that are of interest to the space program that can be either on the space station or that the astronauts may be infected with. So in this approach, what is interesting is that we have used only 4 fluorescent probes in order to multiplex and detect 6 different bacterial strains. And we have done this by assigning 2 probes to each of our targets.. And then by reading both of them and combining the two probes, we can then delineate which bacterial target we are trying to detect. As you can see here, we deconvoluted the fluorescence images that we took in order to identify the bacterial target based on the assigned fluorophore pair. And this allows us for highly sensitive and multiplex molecular genotyping. Of many gene targets of interest, not only bacteria, but can be used for viruses and others. And our most recent work is to integrate the fluorescence or the wide-field fluorescence imaging in order to enable us to take a single image that can be then used to analyze the droplet data. So, to conclude, there is a tremendous opportunity for the development of integrated microfluidic devices in order to use them for automated, rapid, and sensitive molecular diagnostic applications. And the cartridges that we use, the thermoplastic cartridges that are single-use and disposable, they can be beneficial for the implementation of a complete sample-to-answer point-of-care diagnostic device where you want to use the clinical clinical samples such as blood. Recent advances in novel biomarker discovery and epigenetic or DNA methylation biomarkers allow us to leverage highly sensitive and precise digital droplet PCR technology for molecular diagnostics. While we have shown certain advances, we still need higher levels of integration and miniaturization in order to achieve the desired functionality and make these techniques adopted by the clinicians in order to use them in real point-of-care settings. So I would like to acknowledge all of the people that have worked with me in the past decade, especially the people who have worked on this project, including Danielle, Liviu, Jamal, who's here, Matthias, and our technical officers Alex Moira, Luke, and François. Of course, Abdel also, he's our co-op student that has worked on many parts of this project, and our section head, Theo de Riveres. So thank you for, thank you for your time.
Thank you again, Dr. Malik, for joining us today on behalf of the Departments of Bioengineering and Biomedical Engineering. We'll now have a a question and answer period. So for anyone who would like to ask a question, I'll come over to you with a microphone, so just put up your hand, please. Yes, thank you.
Nice presentation. I really like the research that you're doing. I'm just wondering, can you go back to the blood DNA extraction slide? Way before, way before. Yeah. This one, this one with the animation. So I'm just wondering, you did the DNA extraction of the blood using the system, but do you isolate what kind of cells they are from?
So we take the blood and we lyse the blood. We do complete lysis, right?
Yeah, you lyse them, right?
And then we pass it through the filter in order to extract the DNA.
So the cells are lysed. Yeah, but like there's like red blood cell, there's white blood cell.
There's red blood cells and white blood cells and everything, and it's fine.
Oh, what I'm trying to say is that, yeah, you did not isolate the cells, so what you are taking the DNA from is not specific to the cell type, right?
Yeah, it is total DNA. Okay, okay, cool.
Thank you. Thank you. Anyone else?
Yeah.
Maybe I missed this, and I saw on your image that it says it's fast-forward 20x, but how long does it take, like, in real life for one run of this isolation?
Oh, the isolation itself? It is about 30 minutes.
And I don't really do, like, nucleic acid isolation. Was that compared to the industry standard with the instrument?
It is typically with the kits, it's about 30 minutes, half an hour.
It's about the same, but this is less complicated?
It's about the same, but we don't need to do any manipulation. We just basically Sample in an Excel file, put it there, and press start. It does everything automatically. Thank you. You're welcome.
I don't understand most of this, but there was one slide that had some words that I thought I understood, but I don't know how they fit together. When you were talking about the hydrophobic surface, and contact angle hysteresis, and this being due to it being a heterogeneous surface. Could you say something more about that?
Well, it's a block copolymer that we are using, so the surface is heterogeneous, and this is why we have such a large contact angle hysteresis. This is typical of a block copolymer.
And where does the hysteresis come into the—
It's the advancing contact angle and the receding contact angle are different. So the advancing contact angle is about 120 degrees and the receding contact angle is about 80. So the contact angle hysteresis is about 40 degrees, which is typical of a surface that's heterogeneous, of a block copolymer. Thanks. You're welcome.
Yes, so I will make my questions clear. I was a bit lost between the animation slide with the slide that you have like white blood cell, T cells. So I'm just wondering like what kind of process do you do to—
So typically when you want to For example, for our application, we are using DNA to correlate it to the white blood, to specific white blood cells that we have. And we are using, we are doing this by looking at the methylation pattern. So the methylation pattern of different cells is going to be different. For example, for the regulatory T cell, the one gene region is going to be unmethylated, but it's going to be heavily methylated in all the other. And also for the CD3+ T cells is the same. There is another gene region that is where the methylation pattern is going to be different than all the other. The genomic sequence is the same. What is different is the methylation pattern itself. So when we extract the DNA, it's the total DNA of all the leukocytes, of all the white blood cells that we have.
Yes, but I'm trying to ask is that The process of the blood extract, like DNA extraction, is that like a different methylo— different like, it's not continuous compared to the slide that you showed the DNA methylation of the white blood cell and the T cells? Because I feel that, yeah, when you extract the DNA from the blood, those, like this is like a mix of like so many different types of cells, right? White blood cells, right? Yeah, and there's like T cells as well in there. T cells are white blood cells. Nucleocytes and T cells, to be specific. So my question is that you did not isolate those types of cells, and then the slide afterwards, you also specifically look at the T cells and the nucleocytes. I'm just wondering, do you do like any other process to isolate those cells?
Okay, so T cells are a subset of the white blood cells.
Um, nuc— to be specific, nucleocytes and T cells are— nucleocytes? Nucleocytes, yes.
They're all white blood cells. These are all white blood cells, right?
Um— Okay, what I'm trying to say is that there are different types of white blood cells. Yes. But how do you confirm it's like a specific, those types of white blood cells?
So we are looking at the methylation pattern. So if you look at, for example, the genome-wide studies, like maybe that's going to be more clear if I show it. Okay, here. Right? So we are not looking at a specific genetic sequence, right? The genetic sequence is the same. But in order to delineate the specific cell that we are looking for, for example, CD3+ T cell or the regulatory T cell, the methylation pattern between these two cells are going to be different. So we are looking specifically at the methylation pattern, and we know exactly from the genome-wide sequencing, we know exactly the region where the methylation pattern of CD3+ T cells is unique, is different than all the other cell types. So we are then targeting this specific gene region with the specific methylation pattern that we know is different from all than all the other white blood cells, and we are looking at that. So we are trying to detect that. We are quantifying exactly how many of these sequences that have this methylation pattern we have in the solution, and we are correlating this to the total DNA that corresponds to all the white blood cells. And then by dividing these two quantities, we can get the proportion of how many CD3+ T cells we had in the original sample among all the cells. And we are doing this for two different cell types, for the CD3+ T cells and the regulatory T cells. Is it more clear? Yeah? Okay. Yes?
[Speaker:MALE_SPEAKER] Our genomic isolation is based on reference or average But if you take somebody that is sick, can you then differentiate or associate methylation with disease or something like that? Absolutely.
So even for immunological disorders, for example, if you're sick, your white blood cell count is going to be different. And a lot of it, researchers have now been showing that a lot of it is correlated to the methylation itself. Also for cancer. Your exposure to some toxic substance, your methylation patterns, they're not static, they will change. It's a dynamic mechanism and it will change. And this is why it can be used to diagnose cancer, for example, where some of the genes will get turned on, like tumor suppressor genes are gonna get turned off through the methylation itself. So by looking at these methylation patterns, then you can diagnose cancer probably much faster than using biopsy-based techniques. You can do prognostic testing, so people who don't have yet cancer, but their methylation patterns may start to change and they might develop that. You can also use it to see how the person responds to a specific treatment. So it's a very powerful method that can be used for many different applications in molecular diagnosis.
The applications are amazing. Yeah. Very nice talk. Thank you.
These methylation patterns are one particular epigenetic phenomenon. Are there other?
Yeah, I mean, there are other— there are chromatin Their chromatin winding, their— Jamal, you're the expert.
The methylation is the biggest one, but obviously there's the interference for the micro— the RNAs as well, and these also play a role, but— the methylation is definitely the biggest one that, like, we see right now, for sure. It's one that people are looking at.
Absolutely. Any other questions? All right, so if there are no— oh, there's one more.
Thank you for your presentation. It's very cool technology. I have a two-part question. I'm curious, for the first question, I'm curious why didn't you use flow cytometry to compare DD-PCR?
So we don't have flow cytometry available in our labs, so this is the main reason why we used manual immunofluorescence staining.
And I was wondering, since the samples that you collected were blood samples, would you also be be able to collect biopsies, so tissue-resident immune cells, and then analyze those with your—
Everything that you can extract the DNA from, basically, you can use. I mean, this technology allows you to use archived samples or old samples, unlike flow cytometry, for example, where you need actually fresh samples. So yeah, anything that you can extract your DNA from, you can use it. Thank you. You're welcome.
All right, if there are no further questions, please join me in thanking Dr. Malik once again.
Thank you.
Have a great afternoon.
More from Joshua







Scientist Stories: Hans Waterham, The value of phenotypic assays in peroxisomal disorders




Scientist Stories: Joel Zlotogora, Genetic carrier screening programs for reproductive purposes