Scientist Stories: Mark Daly, Translational Genetics & Large-Scale Genomics to study Human Disease
Mark Daly traces how genetic variation became central to medicine, from Mendel through the HapMap Project to modern genome-wide studies. He shows how mapping recombination hotspots and creating reference panels let researchers find thousands of disease-linked genetic variants. Examples include drug responses in diabetes, eye disease genetics, and warfarin dosing.
Chapters
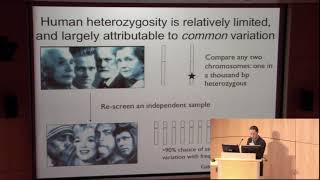
Good morning, everyone. My name is Mark, for those of you I haven't met, and we're going to continue today with the primer in general medical and population genetics. And I've got, you know, sort of two topics merged into one. One is a little bit of background on human genetic variation, what it is, why we're interested in it, and then give a retrospective now over the last decade of progress in the HapMap project and related projects for creating resources that, you know, we really fundamentally lacked in human genetics 10 years ago. So human genetics is, of course, not really about prediction of risk, although in some cases that's a nice outcome. It's really much more about developing a knowledge base for therapy and prevention in the future., and we really care a lot about this topic of genetic variation and linkage disequilibrium and these other things that I'm going to explain to you because, of course, we really lack, for many diseases, a fundamental understanding of where the biology of those diseases begins, where those diseases really come from, and without that fundamental understanding, we really lack an ability as a scientific community to develop effective treatments and preventives against those diseases. So, how does human genetic variation matter? Well, I often like to start out this lecture by pointing out just some examples where human genetic variation influences a medical phenotype of interest. So, for example, polymorphisms in drug targets that are effectively treated by type 2 diabetes. The sulfonureas and thiazolidinediones. These genes are effective drug targets for diabetes, but they also harbor genetic risk for diabetes. And so, not surprisingly, when we discover genes relevant to a disease, they may prove in some cases to be effective therapeutic targets. And so finding many more such genes could provide new inroads and new mechanistic ideas on how to treat disease. An example from age-related macular degeneration, this was a disease that 5 years ago very little was understood about its etiology, but starting with some of the first genome-wide association studies, now this is quite a bit more than 18 months ago, a significant portion of the heritability of AMD has been explained not in eye-specific, you know, pathways or genes or anything, but actually in a fundamental process of the immune system, the complement pathway. And so before these genetic studies started happening over the last 5 years, there was, of course, a great deal of research on macular degeneration and a great deal of research on complement, but hardly any articles that ever even mentioned those, you know, side by side or related to each other. And the sea change in the way that we look at disease after we understand some of the origins of genetics are exemplified in this example by the ability to translate human-observed, you know, gene deficits that cause disease into new and effective mice models for studying disease, to retool the pharmaceutical industry, at least those companies that focus on age-related macular degeneration, to attack the the root causes of disease rather than simply guessing at hypotheses for the symptomology of disease. Now, in this case, and in some other cases, we also do find that there is personal risk assessment that's possible given the genetic results. And given the first 3 genes that were discovered as related to age-related macular degeneration, we could take, for example, a population of individuals and actually identify that there were some individuals in the population that were at extremely high risk of developing disease, maybe 100, 200 times greater risk than individuals down here that had uniformly protective genotypes. And that level of difference is actually quite significant because severe age-related macular degeneration is a very common cause of late adult onset blindness. In fact, maybe 5% of the population will develop it given sufficient age. The individuals up here that can be identified prospectively in a genetic study are at greater than 50% risk of developing this disease, while those with uniformly protective genotypes actually have far less than a 1% chance of developing disease. And so, as ideas about prophylactic interventions are developed, they can be applied to very specific subsets of individuals. And this concept is, of course, a very powerful one for the pharmaceutical industry, who need to test the effectiveness of drugs at preventing disease. But of course, most diseases are quite rare, and so one can't just pull people off the street and say, "Gee, we'll give you this, and did you get disease or not?" Because you would need to test tens of thousands of individuals before you got any significant observation about whether or not the drug was working. Another example where genetics has started over the last decade to influence our thoughts about human medical relevant phenotypes is in the dosage of drugs. And for example, here, warfarin, which is the most common anticoagulant, also known as Coumadin, its effectiveness and its safety are really critically dependent on dosage. You give too much of this, you're at risk of over-anticoagulation or hemorrhage. And you give too little of it, it's not effective at all for an individual. However, there's a widespread variation in individual dosage. And so, what eventually comes to pass over— is that, you know, through identification of genetic variants and also other epidemiological measures, one can actually begin to predict what effective dosage might be for an individual and identify before going through many cycles of testing the effectiveness of the drug, changing the dose, and— and repeating a number of times, identify members of the population who require a very high dose to get effective anticoagulation while not placing at risk individuals whose genetic profile would suggest that they require a very small dose. So, finding genes is really the key to tapping into all of this potential medical benefit, and so The problems we were faced, you know, over the last 10, 20, 30 years has been developing strategy to actually find those genes, and it hasn't been as easy as it might seem today in light of the progress of the last 10 years. So, of course, the starting point for all genetics really goes back to Mendel, and he was the first really to recognize that there were these discrete units, which we now come to understand as genes and genetic variants. That are inherited, and that this variation in these units could be responsible for phenotypic differences. For example, the shape, size, and color of peas and corn and other things in his gardens. But he, of course, didn't have a concept of genes or DNA or even the molecular layout of chromosomes. And so one of the things that confounded Mendel was that while most examples behaved in a very— of phenotypes such as green and yellow and shriveled and smooth behaved in a very simple fashion that suggested they were independently associated, there were some instances where a cross could be set up between parents that carried clearly two different phenotypes were put together, and the expected observation, if there was independent assortment of colored and smooth and colorless and wrinkled and so forth, was not observed at all. And in fact, while there were clearly a mix of colored and smooth and colorless and wrinkled offspring from this cross, almost all of those traveled together, and there were very few examples where there was a colored pea and it was wrinkled, or a colorless pea and it was smooth. And so, why this came about was, of course, that some of those genes, in retrospect now, and 150 years later or what have you, actually turn out to be on the same chromosome and are passed along in tandem unless a meiotic crossing over event occurs on that chromosome in the parents that are producing the offspring. And so, this, of course, confounded Mendel deeply, but it provides really the underpinnings for every genetic mapping effort that has taken place in the last 100 years since then. So, the idea of being able to create maps of chromosomes, and really maps of genes along chromosomes, began nearly 100 years ago with the work of Morgan and Sturtevant and others. And what they realized was that, in fact, the observations that Mendel had made make a great deal of sense if you think instead of genes being independent grains of sand, you think of them as being arrayed along, linearly along a string in some way. And that because they are linearly arrayed on a string and recombination, I mean, of course they didn't recognize exactly what these mechanisms were, you would see co-inheritance of certain flavors of gene A and gene B, for example. And so almost 100 years ago, Sturtevant created the first genetic map in which the order of genes in this— in the case of their experiments along the Drosophila sex chromosomes were laid out and, you know, correctly to this day represent the order of those particular genes underlying the phenotypes that they were studying.. And this then evolved over the course of the 20th century to strategies by which we might identify, first, the co-inheritance of a disease with another gene marker, for example, a blood group marker that shows reliable inheritance. And so the concepts of gene mapping were really fleshed out in the 1940s and the 1950s Before we even had an understanding of the structure of DNA, before we had an understanding of any molecular techniques for capturing that information and testing the information, one could examine, using the same mathematical techniques that we use today with molecular data, the co-inheritance of disease mutations in families with different protein markers and different blood group markers that showed co-inheritance through various experimentation. And so this became, in the latter part of the century, the real bread and butter of human genetics, an ability to study the genomes of individuals and take families with many affected individuals with a disease and identify genotype-disease relationships via the segregation of, in the 1980s and '90s, genetic markers, genetic polymorphisms along a chromosome, with disease state. And this allows us to zero in very quickly in cases where there is a direct and causal relationship between genotype and disease. So if a certain mutation in a gene, for example, inheriting two mutated copies of the cystic— the CF transporter on chromosome 7 causes cystic fibrosis. In the case where those relationships exist in that causal and, you know, determinate deterministic fashion, what happens is we can see in the cases of these families that there are certain genetic polymorphisms in that family that happen to map to chromosome 7 that track with the disease, that the individuals who get the disease get a certain DNA variant and the individuals who don't get the disease do not inherit that DNA variant. And that tells you you're getting close to the gene and the mutation. A tremendous amount of effort was put forth, and most in particular, as you can see here, in the 1990s, to apply this strategy of screening the genome with a, you know, a small set of markers in densely affected families for severe Mendelian disease and also for complex disease. And the striking result was that we had a starkly different outcome from those studies, despite a much greater investment in the study of human complex and common diseases, hardly anything was learned about the genetic and therefore biological origins of those diseases, while literally thousands of mutations underlying severe and, and clearly and primarily monogenic genetic disorders were identified using the same techniques. So what began to become obvious throughout the 1990s as we continued to see this divergence in the pink and blue curves, was that complex diseases and common diseases were in fact not behaving— and we knew this going in because we knew that they didn't segregate in a cleanly dominant or recessive or X-linked fashion in families. But common diseases and complex diseases actually quite sensibly were the results of not only a single gene, but many, many genes in the genome. Contributing, as well as many environmental exposures that are relevant to the disease state. And that those genes and environmental exposures didn't instantaneously or magically in some way give, you know, one person an MI at age 65 and another person diabetes age of onset 55. What they did was they influenced over a lifetime of exposures, both genetic and environmental, a variety of biomarkers, biomeasures, phenotypes of the individual that over time increased risk of ending up in a certain disease state at a certain age in the clinic. And so this becomes a much, much more challenging scenario to identify then direct relationships between single genes and disease state. And so as a result, the strategies that we did— that we had developed for that were effective in the Mendelian case were not effective in the case of complex diseases. And so around 2000, we had gotten to a point where we recognized what we were lacking in terms of resources and concepts and tools for studying much more complex genetic scenarios. And what we really needed to do was be able to study, you know, every base in the genome and evaluate whether there was any variation there, and then test whether that variation influenced any particular disease outcome of interest. This was, of course, totally infeasible, and it's still only now, you know, with technological advances in sequencing, becoming maybe possible. But at the time, we had none of the tools that were possible to do this, and we recognized that we needed to understand— we even needed to understand the nature of genetic variation and create catalogs of genetic variation. At this time, the Human Genome Sequencing Project was drawing to a close, but this was to collect one static version of the human genome. It didn't tell us anything about where the genome varied and how that might influence diseases. We also needed to recognize that we needed to develop laboratory tools to test DNA variation comprehensively, and I'll hearken back to how different today's, you know, standards of technology are that we apply in the lab from just 10 years ago. And then we needed to consider a whole new host of analytic methods to interpret those results, because clearly the strategies that we had taken and honed over years were not the ones that were going to carry us forward in complex disease. So, starting with sequencing studies in a very small scale that were done around and part of the Human Genome Sequencing Project. It came to pass that, you know, the Human Genome Project was not actually being conducted on a single individual, but was being conducted on, you know, sequence from libraries that were created from, you know, a handful of different individuals. And so, there were many opportunities to compare the sequence of a region of the genome sequence from one individual and from another individual. And what we began to find was really for the first time empirical understanding of human genetic variation. And so when we compared two chromosomes in that fashion— and this was work that was led by Stacy Gabriel and David Altshuler and others about 10 years ago— we began to recognize that there were actually differences in any two human chromosomes about once every 1,000 base pairs. And that interestingly, when we found those differences, most of the time those were not private mutations, you know, located in one of those two chromosomes. The vast majority of the time, if we would go and screen those particular variable sites in the genome in a larger panel of individuals, such as everybody in the room here, we'd find that in fact there was a very high probability that that was a common site of DNA variation, that it was simply a polymorphism, as we came to call them, where this is a place in the DNA where some people have an A and some people have a C, for example. Okay, no big deal. What was a big deal was that the genome was, of course, 3 billion bases long. It still is, in fact, 3 billion bases long. And it's very actually difficult to pick these out, especially with the technology that we had at hand those days, because If you blink, you sort of miss what most of these differences are. The vast majority of them are just simple single base changes scattered in and amongst the, you know, infinity of a DNA sequence of a chromosome, and don't actually tell you much of anything about what their function might be or whether or not they could be remotely interesting. Now, as I said, most of the DNA variants that we found were of that simple flavor, but there's actually many, many different forms of genetic variants that are of interest to human geneticists. And while the single nucleotide polymorphisms, or SNPs, are the most common form that we find, the other forms of DNA variation you might sensibly look at and say, "Gee, these might be much more, in some cases, severe or likely to have a functional consequence," and that would be correct. However, there's of course a lot less of them. So it's unclear which in the fullness of time are going to be more important. So as broad-thinking geneticists, we try to study all of them. And so there are small and large insertions and deletions. There's all sorts of complicated regions of the genome that are rather repetitive. And because they're rather repetitive, they're more likely to mutate again and become even more repetitive. And as you'll see, there are large duplications, inversions, and other types of rare events that in some cases have profound effects on whole genes. So, that seems like a lot of DNA variation, and it is, because it's not— both being the genome is large, and being that you find in any two chromosomes a difference every thousand bases, you know, projects out to millions and millions of DNA variants in the human population. Fortunately, however, that total and that variation rate in humans is about the smallest of any organism on the planet. With the possible exception of the cheetah, that is, and other, you know, very specifically and extremely endangered, you know, animals, humans really do have the lowest DNA diversity of any species on the planet. So while people often focus on the differences among ethnic groups and racial groups and so forth and our cultural differences and so forth, none of these really have anything to do with the actual content of our DNA because any two human beings are more closely related no matter where you take them from in the globe than any two of any other type of animal that you might choose. And of course, for microbes and pathogens and, you know, there are organisms that have, you know, drastically, you know, many orders of magnitude times the polymorphism rate, which of course makes those a lot more, you know, complicated to study in sequencing studies. As I said, with that variation rate that we see across human populations, there are about 10 million, give or take, commonly variable sites in the human population. It's a round number, it's of course not precise. And interestingly, they give us some very direct insights about the history of the human population. What we find when we study populations from throughout the world, or at least samples of populations from throughout the world, the vast majority of the DNA variants that we find are either found in all populations of the world, or there's a rather significant fraction of variants that are uniquely found in African populations. And this is, of course, a direct hallmark of the Out of Africa migration of the entire human population, that all humans have their origins in Africa, because of course not everybody came out of Africa. Only a small subset of the human population came out of Africa, and so by definition, only a small subset of human genetic variation came out of Africa. It turns out that it's actually the majority, because most of the variation is common. It doesn't actually take all that many people to carry genetic variation in the population forward. So, if, you know, everybody in the room went off to a desert island and formed a new population, almost all of the genetic variation that's common in the world would be found in that small island population. The other thing that we began to recognize at the time of these sequencing studies, you know, were getting underway, is that The mutations that we see, because they're rather infrequent, actually date back to specific, in most cases, single mutational events at some point in human history. And this has important ramifications which had been already tapped into in Mendelian disease mapping for a number of years. And this was the following. Basically, mutation occurs or enters a population. Let's say if we all did form that island population, each of us carries some unique DNA mutations that are actually private. Maybe it's only a few hundred or what have you. But anyone in the population that came after us, be it 5 generations, 10 generations, 100 generations, that inherited that DNA variant inherited it because at that point in the genome they traced their ancestry all the way back to this original yellow chromosome that carried the mutation, being the only one in the population or the first chromosome on which it arose in human history. And so this opens up powerful possibilities for gene mapping because what happens is this means we can track disease-causing mutations in an indirect fashion. So, the concept of linkage disequilibrium that I briefly introduced, or linkage even, you know, is a powerful one for gene mapping because when, for example, this new mutation arises, it will always be found with this other mutation that had arisen previously because this is the chromosome on which it arose, unless and until a recombination happens at some point in between those two sites. And, of course, when two sites are very, very close together, recombination is infrequent because in each generation you expect only about 1 recombinant every 100 megabases of DNA. And so that means it could take, you know, if 2— if a mutation and a polymorphism are a few kilobases apart, it could take hundreds of generations or it could never occur that a recombination intercedes in between those 2 sites. And so this has led to the sort of, you know, the concept which, you know, grew up in the Mendelian gene mapping days of the '80s and '90s of linkage disequilibrium. This indirect idea that linkage is not only a thing that we can see in one generation passed on from parents to children, but when markers are very, very closely spaced and a population in particular is very, very restricted, we can see it over tens of generations in many cases and even more potentially. So, you know, as I just described it to you, You could imagine an isolated population where one individual has a mutation, and what is then observed 10 generations later when you come back to that population is that everybody who inherits the mutation also has, you know, a significant fraction, maybe a few megabases or what have you, to the left and right of that original yellow chromosome. And this creates a recognizable situation for gene mapping. Because what it creates is a scenario where everybody who has the mutation, and therefore everybody who has the disease that results from that mutation, has an identical genome sequence for millions of bases surrounding that mutation. And I said any two chromosomes have a difference, like out here they have a difference every 1,000 bases. But this whole group of individuals has identical DNA sequence for millions of bases surrounding that mutation. So that's really a very, very striking statistical signature, which actually isn't so hard to find if you were to put down, for example, a few markers, just a, you know, a DNA polymorphism every million bases in the genome. This technique, as I said, was very powerful in Mendelian mapping days when diseases— when we were looking for diseases that were caused by mutations in a single gene, and often there was one predominant mutation as there is in cystic fibrosis in Europeans, the delta F508 mutation. And sitting behind this boy— this is from 1989— the seminal gene mapping work in cystic fibrosis by Francis Collins and Aravinda Chakravarti and many other colleagues is what amounts to basically a haplotype identity picture that shows all of the chromosomes of CF patients. And you can see they're color-coded by sequence identity. And what you can see is more than half of the chromosomes carried by CF patients in this— around this CFTR gene that was identified for, I think this is about 500 kilobases to the left and right of the gene, are identical to one another. And this is, of course, a signature that even at that time we recognized really couldn't have arisen by chance. So, these techniques linkage and then the linkage disequilibrium mapping were dramatically successful in the 1990s, as I showed you, for the identification of mutations underlying a whole host of severe genetic disorders, as well as severe and early onset forms of a lot of, you know, what are typically late onset diseases. I began my, you know, genetic studies of a of disease about 15 years ago focused on the inflammatory bowel diseases, which at the time we thought were somewhat simpler and somewhat a little bit rarer than your average common and complex disease because they had a somewhat higher heritability associated with them. If you had a sibling with Crohn's or colitis, you were 20 or 30 times more likely to develop Crohn's or colitis yourself. And these are really debilitating inflammatory diseases for which there's very little diagnostic confusion with other diseases and constituted maybe a best-case scenario for a complex and likely polygenic disease. And I don't think at the time we realized just how complex and polygenic diseases were likely to be. So we originally took the sort of traditional linkage approach and identified a region of chromosome 5 that was particularly enriched in early-onset Crohn's disease cases and began what was an extremely laborious process at the time of identifying DNA variants in the region and testing them for potential involvement in Crohn's disease pathogenesis. And so we zeroed in on a region about a megabase on chromosome 5 as having not only, you know, being at the peak of this this linkage, but also showing DNA variants with specific alleles. So, if it's a single nucleotide polymorphism, it's an A or a C, that the cases of Crohn's disease were greatly enriched for the C form of that polymorphism versus the A form. And began to focus a study on this region of the genome. Now, this being more than 10 years ago when we were doing this, At that time, there was no map of DNA variation. There were no global resources of DNA variants. There was no HapMap, and there was no really efficient sequencing technology. But what we had to do was use the sequencing technology of the day, basically PCR amplifying small fragments of a few hundred base pairs and running them out one at a time on a number of patients to collect DNA variants throughout the region. And so we engaged in that, and that was called SNP discovery. And nobody has to do SNP discovery anymore because you can go to any region of the genome, and more than 10 million of those common DNA variants are now in databases, and we know exactly where they live on the human— computed— completed human genome reference. Actually, this was done even before there was a completed human genome reference, so we sort of had to string that together to a certain extent. So, what was discovered was that in this region there were a number of single nucleotide polymorphisms that actually did appear to have a rather significant association to Crohn's disease risk. And so it was clear that we were on to something, but it wasn't clear exactly what we were on to, because none of the DNA variants that we discovered— and, of course, we focused a lot of the sequencing on the specific exons of the genes in the region. None of the DNA variants that we discovered seemed to have a strong association to, or were correlated with, any specific functional variants, any, you know, missense or nonsense changes in any of these genes, or splice variants, and so forth. And those were the only things we knew how to look for in those days, because that's what, you know, pretty much all of the Mendelian diseases that we had mapped were caused by. And so this was a bit perplexing, so we kept pursuing the more detailed study of the variation patterns in the region. And so we did a lot of this resequencing ourselves in some patients and a single control. Didn't really matter in retrospect whether we had picked patients or controls for the sequencing. And genotyped what was a very large number of single nucleotide polymorphisms, 100, for about, you know, 250 individuals with Crohn's disease and 250 control chromosomes. And so, what we found was, you know, quite unexpected. I mean, in addition to it taking, you know, more than a year to actually genotype 100 SNPs, which now seems somewhat laughable in light of the fact that we have SNP arrays which can genotype a million SNPs in a matter of, you know, a few weeks and very little individual effort. What we found was that there were these very interesting patterns of variation across this region that we were studying, where it seemed that for some reason there were some parts of the region that had a very high diversity, where lots of different sequences of variants were observed. And there were other parts where there was particularly low diversity, for example, this little valley here, which suggested that surprisingly, you know, most of the chromosomes that we observed matched other chromosomes that we observed. And the patterns we saw were actually quite striking. Here's an instance where across about 100 kilobases, we had typed 10— 8 different single nucleotide polymorphisms strung across this 100 kilobases, and observed that the vast majority of the chromosomes that we studied either carried this particular sequence of variants or the complete opposite sequence of variants. So, these are single nucleotide changes. This is a G or an A, and this is a G or an A, this is an A or a T. And nearly all of them were in these two possible sequence configurations. Hardly any of them used any of the other 2 to the 8th possible combinations of alleles through this region. And the only way that this could make any sense whatsoever is if this region was passed down in tandem not from parents to children in one generation, but really across the last hundreds of generations of human evolution. What we then were able to sort of begin to document was that there were, instead of recombination being a force which creates new assortments of these alleles anywhere, there were particular sites in the chromosome where we found clear rearrangements that were the result of recombination in meiosis. And therefore, at some point, whether it's in the last generation or a previous generation, a combination of the alleles in black and the alleles in blue were created by a recombination and then passed on in a new configuration. But what we didn't see was we didn't see any evidence of those recombinations happening in between these two markers or these two markers or these two markers, but only at these particular points along the chromosome. And this led us to what was the creation of the first haplotype map of a region of the genome back in 2001, where we were able to sort of dissect the entirety of the region into these very compact configurations. And as you can see, some of these regions were actually quite long. Here's nearly 100 kilobases. Containing two potential candidate genes, where instead of looking at the DNA variation as, you know, an infinite mess of, you know, literally hundreds of DNA variants throughout this region of 100 kilobases, what one could do was simply summarize the data as all— everyone in the population carries one of four distinct sequences through this 100-kilobase region. This really compressed the information dramatically that we needed to test for association to Crohn's disease, because we don't need to test every single one of these bases, because we recognize that there are only really 4 distinct DNA sequences that any of the human beings carry in our study. And so, we really need to assess whether or not any one of these particular sequences places the individual at a much higher risk. And as you can imagine, testing 4 little sequence patterns for a role in disease is considerably lower burden than acquiring and testing each of hundreds of different distinct variants, one to another. And so, we did track that down in Crohn's disease to a specific variable site in the middle of this region as strongly associated with Crohn's disease risk. And that result, unlike most of the day, replicated consistently, and this ends up being, you know, just one of many strongly associated regions to Crohn's disease in today's genome-wide association studies and meta-analyses and so forth. But the real lasting impact of that effort and many of the other efforts that were ongoing at the time was to promote the idea that if we could capture a catalog of DNA variants and assemble them into these types of patterns throughout the genome, we could dramatically reduce the burden of studying the entire genome for association. And so the idea of the HapMap Project was to create that freely available public resource, to sort of build on top of the Human Genome Sequencing Project a map of variation and understanding how DNA variation creates, you know, is assembled in patterns across different populations in the world. And to make that data, you know, immediately and freely available in the spirit of the Human Genome Project so that it could empower medical genetic studies throughout the world. Because the idea was very directly, even more so than the Human Genome Sequencing Project, was clearly geared towards accelerating progress in medical genetic discovery, particularly in complex diseases, whereas I showed you success had not been readily achieved by the year 2000, and even by the year 2005. And so we defined in the first paper introducing the results of the HapMap that really while we were now publishing the results of the HapMap and this utility. It really was a tool that, you know, the value of which could only be assessed in retrospect, years later, when we look back and see, did this catalyze the types of discoveries in medical genetics that we hoped it would? So, as I said, the key to the HapMap was, of course, that the data was immediately available as it was being generated, and I'll explain to you exactly what that data looks like. A lot of tools, such as the Haploview tool that Jeff Barrett and Julian Mahler and myself developed, were built initially around the idea that, you know, the HapMap was generating a lot of valuable data, but the geneticists really needed to have access to that data not as a massive database somewhere on the web, but actually to have access to it on their desktop in a way that they could interact with it. And the data gave us a lot of fundamental observations that we had had initial guesses at or insights at from, for example, that study of 5q31 that I described for you. And in fact, really solidified the observation that in fact, as we had suspected when we looked at those simple SNP patterns in 5q31, it is in fact the case that globally across the genome, the vast majority of recombination occurs in very specific hotspots. And, you know, don't read too much into this triangular diagram, but essentially what these little pips along the chromosome are, are single nucleotide polymorphisms across a region of about 500 kilobases. We typed more than 1,000 of them in this case. It's an extremely dense map. And the coloring here simply represents the strength of the correlation between the allele at one site and the allele at another site. And so you can see there are long segments where there are very strong correlations between, you know, whether you're an A or a T here and whether you're a G or a C over here. But then there are these abrupt points where those correlations are almost completely eliminated and that two DNA variants that are actually physically very close together have absolutely no correlation one to another. And that's because these are, of course, hotspots of meiotic recombination that are used and reused generation after generation. So, we segue into the last part of the talk now, which is sort of a primer or retrospective on the HapMap. And, you know, a few years ago this was a sort of primer on how you should be doing, you know, genetic studies. Now, it's a little bit more of a historical retrospective to give you a perspective on how we design studies and what really led us to the era of the genome-wide association study, which has really blossomed over the last few years. And these are topics that are going to be built off— built out on in subsequent lectures. So, the HapMap surrounded samples of individuals from 3 distinct places in the world, not because these were really completely distinct places, but because previous population genetic studies had suggested if you wanted to survey a lot of human genetic variation, then it would make sense to pick a population from, at least one population from Africa, a population of European descent, and a population of East Asian descent. And the population of East Asian descent Han Chinese and Japanese individuals turn out unsurprisingly not to be very tremendously genetically distinct from one another. They're very slightly distinct from one another. But this was, of course, an empirical observation that needed to be made. The historical timeline of the HapMap Project is described here. And basically, the project was launched in October 2001. Which is coincidentally, or not actually exactly coincidentally, the timing of the publication of the work that we had done on that 5q31 region, as well as some other seminal work describing recombination hotspots in the human genome. The phase one of the human genome, of the HapMap production, was done over the next few years after that. And that resulted in about 1 million SNPs being typed across the genome, so that's an eventual density of about a SNP every 3,000 bases. And we typed in all 270 samples that I noted here on the past slide. And this was completed and described in the Nature paper in 2005, while at the same time the project had decided that it needed to go further in a couple of different dimensions. The first dimension was through collaboration with a company by the name of Perlegen. We were able to drive the number of SNPs forward considerably, and the, you know, by sort of expanding the consortium, and got to a Phase 2 HapMap, which was, you know, not as, you know, didn't, you know, reveal any, not nearly as fundamentally as insightful as the original HapMap information, but a more complete and useful tool, which was published in 2007. And then you may have heard about the HapMap3 project, which wasn't an official phase 3 of the HapMap, but which took and expanded the HapMap resource in an even more important dimension, which is to a much larger set of individuals. In a more diverse set of populations across the world. And this is of particular importance as we now get to sequencing technologies, because I think what a lot of our attention is drawn to is in lower frequency and truly rare DNA variants. And of course, surveying the genomes, no matter how thoroughly you survey them, of only 270 individuals is certainly not adequate to tell us a great deal about rare variation in the human population. So, the last cryptic thing on the previous slide was mentioned is this ENCODE HapMap variation project. And early on in around 2002, 2003, we realized that we were designing the HapMap, but of course because there was very little fundamental information about linkage disequilibrium patterns and how much DNA variation there was, we really didn't actually know how dense we needed to make the HapMap in order to make it a useful tool for medical genetics. So we could type, you know, a million markers, but how would we say that's good enough? Because obviously that's not going to tell us about the stuff that it's not detecting. So what we did was, during phase one of the project, decide to devote a considerable amount of resource, both, you know, laboratory and then analytic, to doing a few regions of the genome, 10 500-kilobase regions scattered on different chromosomes, by deeply sequencing, sequencing them every base pair, and then typing the variants discovered in the 48 samples that were sequenced on all of the HapMap samples. And so we had these 10 little regions embedded in the HapMap where we had a super high density of polymorphisms, basically near complete assessment of common variation, and could use this to then assess, "Gee, all right, in these regions, if we were to type a marker every 5 kilobases or choose markers this way, how well does that recapitulate the overall patterns of haplotypes in the population?" And this is really what drove moving from Phase 1 to Phase 2, because it was clear that there was more information to be gleaned by going a bit deeper than the original Phase 1 HapMap. And at the time, it also gave us a lot of fundamental insights into, you know, how complete are our polymorphism databases. So, you know, not surprisingly, what we were finding was that when we took the variation and, you know, when we sequenced individuals and got every last variable site, we found that while common variation was very well described— and this is just the frequency in the population, 20%, 30%, 40%— So common DNA variants were very well described because they were actually either directly contained in dbSNP or were highly correlated to variants that were contained in dbSNP. Lower frequency variation, 5% and below in particular, were really dramatically underserved by the content of dbSNP. And that by relying simply on polymorphisms that were known at the time, we recognized that, you know, there is a distinct limitation to what we're going to be able to say about lower frequency variation. And this, you know, of course, drove the energy of the field to develop better sequencing techniques that are now— have come online over the last few years. Move ahead a little bit. As I said, we recognized the patterns of variation we were seeing were arising because of recombination hotspots. But basically, as we were building the HapMap, of course, the question was really, to build it out into its effectiveness as a tool. And so the way we really would evaluate the utility of the HapMap as a tool, especially using that high-density— those high-density regions that were defined, was to ask sort of an anthropomorphic question. If I was a causal DNA mutation, you know, what would be relevant to being discovered in an association study would be whether you typed me directly or typed a neighboring polymorphism in the population that was highly correlated to me. And so, what we wanted to do with the HapMap was build it to a point where almost all of the DNA variation was highly correlated to a SNP on the HapMap. And that would then allow us to densely type the genome for a subset of markers and have confidence that we were capturing the remainder. And so, the— we used this high-density regions to estimate the coverage of the phase 2, the denser HapMap, and got it to a point where in non-African populations, 95% basically of the DNA variants that are assessed with this deep sequencing were correlated to a SNP on the HapMap at a very high level, and that the average correlation for a SNP defined in a sequencing study to a SNP on the HapMap was greater than 0.9 in all populations. So this was good because it meant that when we perform an association study to the SNPs on the HapMap, we were very likely to capture any other common DNA variant that didn't happen to be on the HapMap but was associated to our phenotype. And that was obviously the goal of developing the resource. Now, applying the HapMap had a variety of influences, particularly on the development and the interpretation of genome-wide association studies. And this still, you know, persists to the day. We still use the HapMap, you know, every day in our interpretation of disease variation, interpretation of genome-wide association studies. But at the time, the HapMap was instrumental in really building up the techniques and the resources we needed to conduct those studies. So, tagging is a term that hardly gets used at all anymore, but was very important, you know, a good 5 to 10 years ago because we didn't— we weren't able to start our DNA studies with SNP chips that carried, you know, the entire HapMap, you know, information on them. We had to start our DNA studies, you know, looking at candidate genes one by one and choosing markers and developing assays to study those polymorphisms. And so what was— there was a premium on, you know, let's say 7 or 8 years ago, was using the HapMap to choose a maximally efficient subset of markers as small as possible that captured most of the DNA variation. And of course, it's possible to do this because the haplotype patterns are extremely redundant in the population. As I described to you early, here's just a little cartoon version of SNPs and haplotypes across a region. So, we've got 6 single nucleotide polymorphisms across this particular region of the genome. And they assemble themselves rather than into, you know, 2 to the 6th possible combinations, you know, 4 common haplotypes, 4 common sequences that are seen here. And the reason they assemble themselves into 4 common sequences is that a lot of the polymorphisms here are actually redundant one to another. So, as you can see, there's in fact a high degree of correlation between SNP 1 and SNP 2. If you're an A here, you're a G here. If you're a T here, you're an A here. And so, when we perform an association study, we don't need to genotype SNP 1 and SNP 2. We know that if we genotype SNP 1, that that also tells us about the impact on phenotype of SNP 2 as well. They are redundant with each other. And so, we can easily remove a number of markers immediately just with a trivial pairwise correlation. And in fact, we can go further than that and find relationships where, for example, a chromosome, a pattern seen of two particular polymorphisms along a chromosome. So for example, if you have an A here and a G here on a specific chromosome, that completely predicts whether you end up having an A or a C at this polymorphism 6. And so, what the HapMap allowed us to do was it allowed us to find these patterns and recognize them, and therefore design our association studies with the minimal set of polymorphisms required to recapitulate the full haplotype patterns of these regions. So, this was very, very important, and work that Paul DeBacker led when he was working with us He was able to show that, you know, while there were 10 million polymorphisms across the genome and, you know, 3 million of them were directly assessed in the HapMap Phase 2 and so forth, that actually in order to study the genome, if we picked markers really truly efficiently, we could get almost all of the information from the entire genome boiled down to, let's say, about 300,000 well-chosen tag SNPs. And that this would cover the vast majority of common variation in terms of being able to perform an association study. Now, of course, we didn't have technology at hand at this time that allowed us to perform an association study of, you know, anywhere near 300,000 tagged SNPs, but such technologies were being developed, companies like Illumina and Affymetrix, and in fact this process and this— close to this exact number was, you know, formed the selection criteria for the first major genome-wide association product that was put out by Illumina, which coincidentally was 317,000 SNPs that were chosen in a very similar way to what Paul recommended in this paper. So, if you were still interested in picking tag SNPs, there's a variety of ways of doing it, the easiest of which is just And using Haploview, which interacts directly with the HapMap website and automatically extracts data from the HapMap data coordinating site, it implemented algorithms that Paul and others developed directly and allows easy access to these sorts of methods. Now, an important question at the time that, again, empirical data needed to be collected and evaluated to develop an understanding of was we had sampled in the HapMap these 270 samples, and some, you know, group of individuals from Utah were used as representatives of Europeans. Well, how representative were they? Nobody really knew. We had an idea that, you know, since human diversity is so restricted that, you know, probably anybody might do a reasonable job of representing the variation pattern in another population. But, in fact, we were very encouraged to see that population differences were very modest when compared the Utah residents with European ancestry. So, taking the original HapMap sample and then asking, "How well do those patterns describe another sample in independent individuals of Utah residents with European ancestry?" And it described them very, very well, that when two SNPs were defined as highly correlated on the HapMap, they were in fact highly correlated in the next population as well. And so those approaches would be effective, and essentially the information from the HapMap would carry over to other people. But it also carried over very, very well to more diverse and less diverse groups of Europeans. So, for example, self-defined whites from Los Angeles, well, you might imagine that's a more diverse group than perhaps Utah residents with European ancestry. You might also imagine that an isolated Swedish-speaking fishing village on the left coast of Finland might be population-wise somewhat different than those Utah residents. But in fact, in all of these cases, the original HapMap sample of individuals from Utah did a very good job of describing the variation patterns in those populations. So this gave us, you know, considerable optimism, not yet from a technical standpoint, but from a theoretical standpoint, that it would be possible to conduct genome-wide association studies. And so, importantly, the question we were faced with was, is it really going to be feasible to perform a whole genome association study? This is good theoretical work, but can we actually do this in practice? And importantly, as I said, the— tools for performing genome-wide association studies. Genome-wide arrays from Affymetrix and Illumina and other companies started to come online right at the same time. So what a happy coincidence. And this gave a really effective way to realize and test the idea that genome-wide association might be feasible. And so What the first things that were done were, you know, by the companies and by ourselves, were to take these new products and type the SNPs that were on these arrays on all of the HapMap samples. Because what that immediately allowed us to do was to integrate the information that we knew about from the HapMap with the information on these arrays. And we could then ask questions that were similar to the tagging questions. But to some extent, in the opposite direction of the questions we just asked with respect to tagging. Because now there's a company, and they're giving us 100,000 SNPs or 300,000 SNPs. And we say, is this any good? Do I really want to use this for my study of diabetes or Crohn's disease? And so the question was, if we could then take the HapMap and evaluate how complete a job these products from the companies were doing. So, we don't get to pick necessarily the SNPs that they've put on their arrays, but we can certainly use the HapMap to evaluate how good we think they are. And in fact, we do it the same way as those tagging analyses we did, but sort of in reverse. So, if we go back to that region of interest, then what we could do is say, "All right, so here's a region we're interested in." And the Affymetrix chip has two SNPs, SNP 1 and SNP 3, and it doesn't have SNPs 2, 4, 5, and 6 that we know about from the HapMap. But, of course, we can then look at the HapMap and say, "Hey, great. This is, this is fantastic because we know that SNP 1 is actually correlated to SNP 2 and probably some other SNPs." And so we're getting the value of having tested those SNPs as well. And then similarly, we can take the information that the arrays give us and even add further to that, as I'll explain in a moment, even in this crude sense, and could see that, you know, the first genome-wide arrays that were provided by Affymetrix at 500,000 SNPs actually didn't just tell us about 500,000 SNPs, but told us about almost half of the variation or more in the entire genome. So that was a good start, but of course we wanted to improve on that using the information from the HapMap., and in the same way that we could gain more efficiency in choosing markers for our association study, we could take SNP 1 and SNP 3 and look for additional patterns where certain patterns of SNP 1 and SNP 3 in tandem were predictive of other polymorphisms, for example, SNP 4 and SNP 6. And this concept is at the heart of what we all now refer to as imputation algorithms. That we can take the information from an Illumina or an Affymetrix experiment and not simply use it to tell us about SNP 1 and SNP 3, but to actually predict and fill in the genotypes for SNPs 2, 4, 5, and 6 from the information contained in the HapMap. This is really the continued and lasting utility of the HapMap that we tap into every single day, because when we perform a genome-wide association study, We now assume that the information is going to pertain not just to the SNPs on the array, but that we're going to immediately impute it onto the rest of the HapMap to tell us— give us a much more complete picture of how genetic variation is involved in the phenotype we're studying. And so this activity, and it's become much more computationally sophisticated over the last 5 years, really does demonstrably increase the value of those chips. So, where only about 60 to 70% of the polymorphisms on the arrays are directly one-to-one correlated to a SNP on the HapMap, that number jumps to above 80% when you consider those more complex multi-marker relationships. So, this is great and really brought us to the, you know, the cusp of the genome-wide association era. And there were a number of other things that, you know, just peripherally in the last few minutes that I'll mention that we use the HapMap for. They help us downstream in study interpretation, and what I mean by that— and these are things that now, you know, the 1000 Genomes Project that's coming online is going to even allow us to do in more complete and thorough fashions, but even at the time we were able to ask, for example, all right, if there's a SNP that's associated in our association study, we can find out how many other SNPs are in LD or correlated with that SNP and might actually be the causal gene, causal functional variant. Are any of those causal functional variants putatively functional that we could recognize? Are any of them splice or missense variants and so forth? And we can conceivably wrap that back into our association statistic because, as you can imagine, if there's a DNA variant that's tested in our study that's correlated to hundreds of other variants and many coding changes and so forth, that's quite a bit more likely to have a functional consequence than one that's just sitting off by itself somewhere in an intergenic region. And in fact, this was used at the time, even in those early AMD studies, to recognize that this chip, this SNP on the Affymetrix array was actually in strong linkage disequilibrium with a coding variant in complement factor H. And so this was, you know, an early example of how that might be used. The information, you know, regarding imputation has been most substantially influential in what's now become a routine process of meta-analysis or joint analysis of multiple genome-wide association studies, because as you can imagine, So, if I've performed a study using an Affymetrix chip, you've performed a study using an Illumina chip, we put those together and realize, "Gee, I typed a lot of SNPs that you didn't type, and you typed a lot of SNPs that I didn't type, so how do we put those together?" Well, we put them together because all of those SNPs on both products are actually contained on the HapMap, and we can then see the relationships of the polymorphisms on one array to the polymorphisms on the other array. And I won't go into any detail about how that works necessarily. But that's been very, very important to recent progress in complex disease in genome-wide association study. It was also very important early on at allowing us to take published papers, for example, published reports of association between SNPs in the dysbindin gene and schizophrenia and be able to evaluate whether, you know, group 1 looked at SNP 5 and group 2 looked at SNP 8 and they they both claimed association, but do these relations— these genes actually— do these associations actually fit together in any sensible way? And so the dysbindin gene, as a primary example, had 5 different publications, all of which used different markers to study the gene across this— within its relationship to schizophrenia. But fortunately, because the HapMap was coming online, we could see clearly the relationships, and they were all strong and high correlation relationships. Between all of the markers that different groups were using. And what they actually showed was in this case a very discordant picture of how variation might be involved in schizophrenia and actually led us to the conclusion that it wasn't involved in schizophrenia. Because the first group that published on this gene defined some association that said this haplotype over here or these variants that uniquely mark this haplotype over here are associated to schizophrenia. The next group came along and studied the variation patterns in this gene, and they said, "Oh yeah, we see association to schizophrenia. It's over here with these patterns." I'm like, "Wait a second, that's not the same thing." Because if these ones are associated, those ones are not associated, and vice versa. And then subsequent groups jumped on and said, "Oh, we see a little association to this pattern and a little association to this pattern." And overall, what you can see is that these reports were extremely inconsistent. One to another with respect to the role of this gene in schizophrenia. And that when you put them all together, there's actually no relationship whatsoever between DNA variation in dysbindin and schizophrenia despite now a growing set of publications that would have claimed otherwise. But because they had no ability or chose not to integrate these results across studies, no one could actually very easily look at them and come away with the idea that there's actually nothing going on here. And in fact, finally there was a publication from a group that defined that everything but the original haplotype was a risk factor for schizophrenia, and so this was, you know, completely inconsistent. So, as I said, you know, the key expansion of that has been in sort of the integration of different genome-wide association studies, Affymetrix and Illumina being sort of harmonized together by the HapMap. And that this has really been the process, the genome-wide association studies individually, and then the dramatic progress of the last few years in meta-analysis, combined efforts by different groups of genome-wide association studies. And so, in diabetes and Crohn's disease, just to cite two examples, individual genome-wide association studies were performed in 2006, 2007. Gave us a big boost in our understanding of the biology of these genes. And so, not only in Crohn's disease did we see the variation at NOD2 and at 5Q31 that I described earlier in the genome-wide association studies, but a whole host of additional risk factors began to emerge from these genome-wide studies. But it was really in 2008 and beyond when we began to use the HapMap to bring together genome-wide association studies from many different groups that were being performed at the same time, that greater and greater gene discovery began to emerge. And to show the progression in a little more visual sense, you know, there was great progress in 2007 and 2008 across a number of diseases, but that this progress has been amplified even an additional order of magnitude over the last few years. By meta-analysis of genome-wide association studies performed by multiple groups. And today we're just probably now across 1,000 distinct associations for complex diseases defined by genome-wide association study using the principles and still using the data from the HapMap to enhance and complete those studies. And so I think, you know, even though we're just only now 5 years out, We can see distinctly the impact that we had set out to have on accelerating the progress in medical genetic discovery with the HapMap. And it's obviously, you know, on one hand extremely gratifying to actually see how much progress has been made in the last 5 years, and it's in fact very difficult to even go back and remember how laborious, it was to collect even 100 SNPs in 5q31 10 years ago. But we also recognize that there's a tremendous amount of work to come, and that these discoveries really just are the beginning of the road to really understanding how DNA variation influences phenotype, and to actually extracting biology from those discoveries, and then moving into functional analysis that might reveal new pathways to therapeutic intervention. And so with that, I just have a retrospective acknowledgment slide from all of the folks that David and I were privileged to work with during the conduct of the HapMap project in the earlier part of the last decade. And in particular, you know, we were, you know, the HapMap was something that we dedicated a great deal of effort to and got a great deal out of. But it wouldn't have happened without a really expert set of postdocs and other trainees who were in our labs at the time, many of whom you probably know very well, either in person or by reputation. And that it was this core group of individuals that really made a lot of the HapMap happen here, and a lot of the HapMap happen worldwide. And in addition, we had a lot of strong collaborations with other members of the analysis group that that persist to this day, particularly groups at Oxford and down at Hopkins and Gonzalo out in Michigan. So, thank you very much and I'm glad to take a few questions if anybody has any.
More from Joshua







Scientist Stories: Hans Waterham, The value of phenotypic assays in peroxisomal disorders




Scientist Stories: Joel Zlotogora, Genetic carrier screening programs for reproductive purposes