Scientist Stories: Marlon Stoeckius, Inventor of CITE-seq
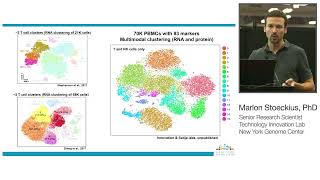
In this talk Marlon Stoeckius introduces CITE‑seq (also called CySeq), a method that tags antibodies with DNA barcodes bearing a poly‑A tail so that protein‑level information can be captured alongside oligo‑dT‑based single‑cell RNA‑seq. He explains the motivation: flow cytometry provides high‑resolution protein phenotyping but limited marker panels, while scRNA‑seq offers unbiased transcriptomes but suffers from high dropout, especially for surface markers. By attaching a sequencing‑compatible oligo to antibodies, the assay yields antibody‑derived tags (ADTs) that are reverse‑transcribed and sequenced together with mRNA. He walks through assay design (barcode, PCR handle, poly‑A tail), workflow integration with Drop‑Seq and 10x, and how ADTs are recovered from the “trash” fraction of cDNA libraries. Benchmarking experiments include a human‑mouse mixing test (species‑specific CD29 antibodies) showing concordant RNA and ADT species calls, and a 13‑antibody panel on cord‑blood mononuclear cells demonstrating near‑zero ADT dropout and strong correlation with flow cytometry. Comparisons to multicolor flow show similar cell‑type proportions and dynamic range, while ADTs avoid the zero‑inflation seen in mRNA. Multimodal clustering that combines RNA and protein data resolves many more immune subpopulations (e.g., 13 T‑cell clusters from 70 k PBMCs with 83 markers) than RNA‑only analyses. The technology also enables cell hashing: DNA‑barcoded “sample tags” allow multiplexing of many donors, super‑loading of 10x lanes, and computational doublet detection. Additional benefits include identification of low‑UMI or small cells that would otherwise be discarded. Stoeckius notes that the method works with any oligo‑dT‑based workflow, is now commercialized through BioLegend, and is supported by NIH and Human Cell Atlas funding. The talk concludes with acknowledgments and resources for protocols.
Chapters
Hi everyone, so I'm Marlon. I'm a research scientist at the New York Genome Center. And BioLegend invited me to talk about this technology that we developed. First of all, a disclaimer. So this work here is free from oversight from BioLegend and shouldn't be construed as an endorsement. First of all, I want to ask who of you guys have ever done single-cell RNA sequencing experience? And flow cytometry? It's almost the same. So maybe I want to show this slide first. All right, so in flow cytometry, it's, you know, I guess everyone of you guys know it's relatively easy to enumerate or characterize different immune cell subsets, right? Relatively easily. You take a population of cells, you have a few markers that are very well known, And then you can, you know, divide up your populations into memory naive states. Let's see. So CD4 cells, CD8 T cells, and memory naive effector states, just by using a few different markers that are very well described, right? But the problem with flow cytometry is, of course, you only look into a few specific markers that you really know very well. And then you can only measure a few markers depending on the technology that you're using. Right. So if you guys heard about single-cell RNA sequencing before, you know, and thought, "Okay, that's maybe also a great technology to use," what you can do with single-cell RNA sequencing, you can basically look into the transcription profiles of many, many cells in parallel. And then you can cluster those cells based on the gene expression profiles. And this is basically every dot here, every dot is a cell. And, you know, the more alike these cells are, they will cluster together in these different islands. And then you can look into the gene expression profiles of these cells. And give them names. So, for example, B cells, you know, will be very easily distinguishable from fibroblasts. But if you look into the T cell subsets, you know, as I talked about before, it's very easy to distinguish different T cell subsets in flow cytometry, but in single-cell RNA sequencing, it's actually very hard to really characterize different T cell subsets because they're very transcriptionally very similar. So, you only have 3 different T cell subsets in this dataset, for example, which was in collaboration with the Hulsa-Tejas lab. And even in the early 10x dataset with 70,000 cells, 70,000 PBMCs, you had around 5 T cell subsets only. And we know there are much more different T cell subsets out there than 5. So, of course, in flow cytometry, then it's easy to characterize those. So, you know, there's actually at the moment really two different worlds. On one hand, you have single-cell RNA sequencing. Which gives you an unbiased view of the RNA transcriptomes of single cells and many single cells in parallel. And then you have flow cytometry or CyTOF, which give you then a really nicely high-resolution picture of only the protein markers. So we thought, how can we actually get the best out of both worlds? How can we, you know, put these two technologies together in order to measure both? And the way people measure protein markers, I guess you know, of course, is with using antibodies that attack with fluorophores or with lanthanides. However, we can't use those in sequencing, right? So we asked us, how can we get a sequence of readout from an antibody binding event? And since most of the single-cell RNA sequencing technologies that are out there at the moment are oligo-dT based, we thought, how about we just tag those antibodies with an oligo that has a poly-A tail? And then this poly-A tail essentially mimics an mRNA molecule and will be reverse transcribed in any sort of single-cell RNA sequencing or other RNA sequencing workflow that's oligo-dT based. And then what we can put in this oligo is a sequence which is basically allowing us to identify this antibody. And in this case, it's basically, for example, like a 10-nucleotide barcode. And you can imagine that a 10-nucleotide barcode or 12-nucleotide barcode or 15-nucleotide barcode will easily have more different sequence combinations than antibodies that are available on the, on the planet. And then of course, the other thing that you need on this antibody oligo is basically a PCR handle which allows you to specifically identify this or PCR up the sequence and then sequence it. In this case, it's just a sequencing PCR handle. So the way the method would then work is you essentially stain your cells the same way you would stain your cells for flow cytometry. And then, you know, you make a pool of DNA barcoded antibodies, stain your cells with these antibodies, wash away the unbound antibodies, and then you pass them to any sort of single-cell RNA sequencing workflow that you could imagine using. It could be even a bulk approach, for example, in here. I'm just exemplifying this with DropSeq, where every so often a single cell then is getting encapsulated in a droplet together with these DropSeq beads, which essentially provide the cell barcodes and the RT oligos at once. And then in the cells, the— sorry, in the droplets, the cells are lysing, and the mRNA molecules and the antibody oligos through their poly-A tails anneal to these oligos, which have these cell barcodes in the droplets. And then they get reverse transcribed either in emulsions as for 10x or in bulk as for DropSeq. And then what happens is you have these two really different molecules. You have one length of full-length cDNAs, which are, you know, 1.5 or more KB long, and then you have these short antibody oligos, which are 180 nucleotides more or less. And in the standard workflow, people, when they do single-cell RNA sequencing library prep, you basically size-select the full-length cDNAs away from something that you trash.. And we actually then amplified these antibody libraries out of the trash, essentially, and without any interfering— interference for the full-length cDNA library preparation. So we said, how can we test this if the method is actually working? So we went to one of the standard benchmarking experiments that people use for single-cell genomics, which is the human and mouse mixing experiment. And the whole idea behind the experiment is if you can identify human or mouse cell based on the transcriptome, We should also be able to identify a human or mouse based on a cell, based on a specific antibody which is species-specific. So what we did is we make a mixture of human and mouse cells, and then we stained them with DNA barcoded antibodies that are specific for human CD29 and for mouse CD29. And then we passed those cells through DropSeq for 10x and then basically made this library prep. And the way you look at these data then in the beginning is you basically plot all human and mouse transcripts measured in all droplets. Versus each other, and then, you know, for example, human-containing droplets will be all aligned on this axis and mouse transcripts containing droplets will be on the Y-axis. And, you know, any mixed population, so if we deliberately overload the system to get a mixed readout from human and mouse, should be somewhere in the middle. And for the RNA data, then, essentially looks like this. So, we got a lot of human-containing droplets and a lot of mouse-containing droplets and a lot of mixed droplets and we deliberately overload the system to get this mixed readout. And now, of course, the question is, do we also get an antibody readout from the human or the mouse cell or a mixed antibody readout for these mixed cells populations? And when you then look at the antibody tags from the human or mouse, the data looks already just by structure very comparable. You will see these nice, you know, mutually exclusive pattern and then some dots in the middle. But, of course, now for every dot here we know what's the RNA annotation for each single dot. And then, if you colorize those based on the RNA, you see, you know, all of the cells that were annotated as human cells are also on the axis here and on the y-axis for mouse. And the mixed cells that were annotated as mixed cells based on their transcriptome have also mixed antibody signal based on their surface. And then, you can do, for example, also count the different cell populations, you know, based on the RNA or based on the antibody tags. So, we call these antibody tags ADTs. And what you see is that numbers are very comparable. So there's essentially no dropout of antibody signals. So every cell that you measure also has an antibody readout. And of course, the method is compatible with other single-cell RNA sequencing workflows. So this was in the beginning when we were still using DropSeq. Now most of the time we're actually using 10x, and the method works comparably well on 10x and other single-cell RNA sequencing workflows that are oligodT-based. So then we next went ahead and asked us what would be actually the best way to really benchmark the system. And as I said in the beginning, the immune system has very characteristic characterize very well based on flow cytometry markers and also based on the transcriptome. So, we basically made a panel of 13 antibodies and looked at cord blood mononuclear cells in a sample. And the first thing that we then do again is we basically cluster those cells based on gene expression profiles. So, every dot here is a cell. And then we see basically the big T-cell cluster, big myeloid cluster, and K cells, B cells. And since it was caught by mononuclear cells, we also see a small population of precursor cells. And now I'm going to show you a few of the markers that we looked at. And, you know, of course we would expect CD3, for example, in the T cells, CD19 in the B cells. And the way I'm going to just now show the data is by showing you the same tSNE plot but only highlight the mRNA levels or the antibody text, ADT levels, for these markers. So CD19 mRNA. Is highly expressed in the B-cell cluster, as you would have expected. And we also see very, very strong signal for CD19 protein signal on the B-cell cluster. And if you look into the other markers, for example, CD11c is a myeloid marker. We see it on the myeloid cells on RNA level, but also on the mRNA levels. CD14 is also myeloid marker. We also see it on the myeloid cells. And even CD34 which is expressed only in less than 1% of the cell population in this sample, we pick it up very nice on the mRNA level but also on the protein level. So, overall you see that the mRNA and the proteins are very highly conserved— very highly not conserved, correlated. But what you can also see is, for example, that there's a lot of dropout of the signal on the mRNA. So, for example, here all these cells, all these T cells should be expressing CD4,, but you actually, they don't. And you see the same problem for CD11c, for example. And that's one of the problems that I talked about earlier. So, single-cell RNA sequencing inherently has a high dropout rate. So, this zero-inflation. And, you know, just by not measuring it doesn't mean it's not there. It's probably just not detected. And we don't see this at all for the antibody tags. So, the antibody tags are almost, there's almost no dropout in any of the cells. So, we called the method then CySeq for cellular indexing of epitopes and transcriptomes by sequencing. And, well, you can measure the immunophenotype and the transcriptome from every single cell, and there's no dropout of the signal. And we think that the method is compatible with any oligo-GT-based single-cell or even bulk sequencing workflow. So, one thing that we're used to looking at when we talk about surface markers, as I said before, is the— are these, you know, biaxial plots, you know, for example, CD4 versus CD8. You know, you see this nice mutually exclusive expression. Expression pattern, CD8 T cells, CD4 T cells. So, we can do exactly the same plots for CITE-seq where you see the same sort of, you know, behavior of the cells or expression of the cells, although that's now a completely different sample. But we have more information about all these cells than just the cell surface markers. We also know what RNA expression each cell here had, each dot had, and to which cluster these cells were belonging to. So, what we can do is we can colorize basically these cells based on the clusters. And then you get really, really nice high-resolution picture of the expression levels of the different markers within the immune system. For example, CD8 is highest expressed in CD8 T cells, and then, you know, we have also NKs expressing CD8, but at a large dynamic range, but lower than CD8 T cells. And then CD4, for example, is the highest expressing— the CD4 T cells are the highest expressing CD4. Positive cells in the immune system, and then also monocytes express CD4, but at lower levels. However, one thing that we now really still don't know from these data, or it's also very hard to deduce in flow cytometry, is where is actually the background. So this is a range of cells that we don't believe anymore. So it's actually the B cells here, for example, the violet cells. Do we believe that they still have CD8 or CD4, or is this just background? So one thing that we can actually nicely do in these type of datasets, we can also mix in a population of cells that's that should be negative that we can use as a background correction tool. And what we did, we essentially just spiked in mouse cells, which are very easy to identify transcriptomically. And then, you know, you can just plot those mouse cells on the background of the human cells, and you see the mouse cells are in the range, give signal in the range of CD4 and CD8 where we would have expected a background signal also to be. So, we can actually then draw computationally cutoffs for the different markers, for all the different markers in the panel that we used. And then say which is the really real signal, what's the background signal. And then of course you can do these type of biaxial plots for all the markers at once in the experiments. And overall you see really profiles that are very comparable to flow cytometry. But we wanted to ask how comparable is the method really with flow cytometry. So for this we did two different experiments, once asking if we see the same proportions and once to ask if we actually see the same dynamic range of expression between the two methods. So, we isolated again cord blood mononuclear cells and then passed them once to Flow and once to CyteSeq using the same markers. And that's basically the Flow cytometry data and that's the CyteSeq data on the same sample. And you see that the overall, even the structures of the profiles are very similar, but also the numbers are very comparable. So, for example, T cells by Flow we say it's 52% of the sample, by CyteSeq it's also 52% in the sample. CD4 T cells, 70% versus 68%. But then if we go down to the effector cell populations, which are less than 1% according to flow, we really also picked those up in CITE-seq. Of course, now how do the marker levels within one marker, how do they compare? How does it compare? So for this, we basically used CD8 again as a model, which I said before is expressed in a large dynamic range in the immune system. We basically sorted different bins of CD8, and then passed them once to Flow and once to CyteSeq. And, you know, you see again the relative proportions are very similar to what we picked up in Flow cytometry or CyteSeq. So this allows us to summarize that basically it gives you very comparable profiles to Flow cytometry, and the dynamic range is also very similar. But CyteSeq then again gives you the added benefit that you have the transcriptional profile, the unbiased transcriptional profile of every single cell in your experiment. Experiment. So now what we can do with this dataset. So now since we have the RNA and the protein measurement in parallel, and if we have more and more protein measurements on top of that, then we can use this data to optimize our clustering. As I said before, sometimes the clustering is relatively bad, right? So, for example, here we see CD4 and CD8 T cells, which are already colored based on the surface markers that we know, but they're really interspersed from each other, right? Because these are very transcriptionally similar cell types, and depending on how deep your sequence or how good your experiment is, you can't really pick up these differences. But then if we use the protein marker on top of the RNA markers and, you know, basically balance the clustering of these two levels of information, you see that the clustering really resolves much better the different cell types. Not only the CD4/CD8 T cells, but also the monocytes get, you know, distributed much nicer. Of course, it always depends on the markers that you're using. So, what we then did is essentially we used 70,000 PBMCs and 83 markers to basically optimize our clustering or get a really high-resolution view of the T cell development, of T cells in the immune system. And I said before, so in our older dataset where we just looked at RNA, we had 3 different T cell clusters, and the 10x dataset has 5 different T cell clusters. 83 markers and this, you know, multimodal clustering, we're actually able to pick up 13 different T cell clusters. We essentially see all T cell clusters that are known, that are described in a healthy individual. And that's just now a few different markers. For example, I mean NK cells— sorry, this is T cells plus NK cells. So the NK cells we're picking up very specifically, CD4 T cells, CD8 T cells, MAIT cells are there. We have the naive and memory separation. And we even really pick up very nicely CD4 regulatory T cells, which are otherwise really rarely visible in these type of datasets. And then, of course, we have different— other different markers that are very specific based on protein, but we also have, since the clustering is now driven partly by the protein and by the RNA, we have also very specific and partially novel markers for RNA. So, we can actually now go back and look for novel cell surface markers for these different type of cells. So, since we have now this DNA barcoded antibodies, we asked us— also many other people approached us and asked, can we actually use the same technology to multiplex different samples the same way you guys multiplex CD45, use CD45 to multiplex essentially different CyTOF runs. And since we have actually then these different surface tags, we might also be able to use the data in order to superload single-cell RNA sequencing instruments. Experiments. So, the idea behind this is essentially the same as for CyTOF. You label your cells with a ubiquitin cell surface marker that has a different tag, and then you pull these experiments together into one run. And then you can isolate it and you can basically analyze these cells all in conjunction with each other, or you can, based on the cell surface tag that you have, distribute those out into different markers— sorry, into the different experiments. And one added benefit that you also have because you have these cell surface markers you can actually also identify these doublets because you have a collision between two different barcodes, and I tried to illustrate this here. So, before I go a little bit more into the doublets, I just want to introduce that shortly. So, typically, these single-cell RNA sequencing instruments, they generate much more partitions or little fractions than we actually use. Usually, we load around 5,000 cells, for example, in 10x, and then you get a doublet rate of a little bit less than 5%. We could also load 25,000 cells if we wanted to, but then we would have a doublet rate of 20%. So, every 5th cell would be a doublet and we wouldn't know which would be the doublet. But if we have, for example, a cell surface tag on top of the cells, we could basically divide out or subtract out the doublets. And depending on how many cell surface markers we're using, you could subtract out, let's say, more than 90% of those cells if you use 10 different markers. And the way this would work is you basically have your sample. You split up your sample into different tags, and depending on numbers of tags, you can identify more doublets. And then you basically superload this instrument. So for example, 25,000 cells, and you would have a doublet rate of around 20%. But because we use 10 different tags, we can identify 90% of those, which ends up to be then a doublet rate of only 2.5% when having 20,000 cells in one single lane of 10x. So the way we made the proof of principle experiment is essentially just by using 8 genetically distinct donors. We labeled them all individually and then we pooled them back together and then we superloaded one lane of 10x. And then we did the analysis and tried to pull them apart but also tried to identify the doublets. And then the first thing that you do, you can cluster those cells based on the, you know, standard RNA expression levels and then you see, you know, this is now very shallowly sequenced but you still pick up the different, you know, immune subsets. And then you can pull those different populations apart based on the cell surface markers. And then you end up with exactly the same sort of numbers of cells that we would have expected. And funnily enough, also with exactly the right number of doublets in the middle, or the doublet population between the two different— between the different barcode combinations. It's a little bit easier to see in a heat map where you see that you can easily really divide up the different cells into their respective groups depending on the marker that we used. The doublets have combinations of all the different barcodes., then negative cell populations are also negative as expected. So we spiked in a negative pool. Since we used different genetically different donors, we could use a method that was developed by Jimmy Gee's lab at UCSF, which he called de-muxlets, to de-multiplex samples of genetically distinct donors. And you see that the overlap between the de-muxlet classification of genotype and our cell hashing is very, very comparable. But we have, of course, the added benefit in this technology that we can— we don't have to use genetically distinct donors. So, what you can do with these type of experiments? So, one way, one thing they can do is multiplex, of course, different samples, but also multiplex different samples or do different experiments that would be otherwise pretty cost-prohibitive. For example, for flow, you know that you have to, you know, titrate your antibody concentration and usually you do many different concentrations in order to arrive at the point where you think the signal or background is the best. And for CySeq, that would be pretty expensive to do 10 different experiments. Of course, 10x would be happy about that. But now what you can do, actually, you can do this one experiment in one go, essentially. And this is what we did for a few antibodies. And you see that you get really nice comparable profiles of what you get for flow cytometry. But overall, the recommended concentrations for the antibodies are very similar to what we see also in CySeq. One more added benefit to this is actually that you can— you are able to maybe identify very bad quality cells or very small cells. So, that's a typical single-cell RNA sequencing experiment where you get the numbers of UMIs per droplet and the number of genes per droplet. And we typically say these are very probably doublets or very large cells, then these actually are real cells that are somewhere in the middle, and then all this stuff here in the bottom is actually ambient RNA or background. Simply. But it could be also that there's actually a few very small cells which have only very few genes expressed, or which we don't sequence very deeply, or maybe bad quality cells that are in this range that we could somehow be able to filter out if we would have this additional cell surface marker information. And we do. Now, since we have this cell hashing surface marker, we could actually now pick out cells that have very specific signal for one of those cell surface hashes, and where can we predict which cells might be real cells but just lowly sequenced cells, and which is really background ambient RNA. And you see that if we basically then cluster those low background RNA cells, you really— no, sorry, these low UMI cells, you see that they fall into the different populations of cell types that we would expect. And the background cells are actually just, you know, a random sort of arrangement. So with this, I would like to close by saying, so first, CySeq allows you to measure the immunophenotype and the transcriptomes of many single cells in parallel. There's no dropout of antibody signal, and we think that the signal that you get is very comparable to flow cytometry, but you can measure much more markers. So we went up to over 90 markers now relatively easily, and it's compatible with all oligodT-based single-cell RNA sequencing workflows. And the multimodal clustering has really the power of resolving your sample much more deeply. Compared to before. Cell hashing allows you to basically multiplex different samples, but also superloads single-cell RNA sequencing instruments. And, you know, you have an added benefit that you might resolve low UMI cells, which are very small cells that would otherwise be lost in your datasets. I'd like to close by thanking especially the members in the Innovation Lab, so Peter, Stephanie, and Brian. This project was a real great collaboration with the lab of Rahul Satish. They did all the computational analysis, Christoph and Xue. Prateep helped us to benchmark CySeq over multicolor flow cytometry. And also, of course, the people from BioLegend helped us a lot with antibodies, and they will also be offering these reagents now commercially. If you have any questions, feel free to send me an email anytime. And also, there's a website that we set up where we keep the protocols always up to date, and there's a lot of new updates that also Peter is actually going to talk about more in the 10x Genomics session for, for example, the 5' 10x kits. And we are funded by the NIH and also Human Cell Atlas, ZCI grant. Thank you.
More from Joshua







Scientist Stories: Hans Waterham, The value of phenotypic assays in peroxisomal disorders




Scientist Stories: Joel Zlotogora, Genetic carrier screening programs for reproductive purposes