Scientist Stories: Stephen Quake, The Cell is a Bag of RNA
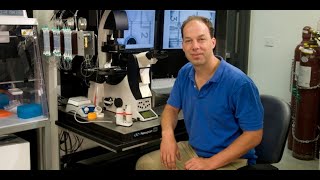
In this KNI Distinguished Seminar, Professor Stephen Quake recounts his interdisciplinary career—from theoretical physics to bioengineering—and presents a unifying view of cellular identity based on comprehensive RNA profiling. He frames the long‑standing debate between biochemists (who treat the cell as a "bag of enzymes") and cell biologists (who emphasize structure) and argues that enumerating all RNA molecules provides a powerful proxy for cell state. Quake reviews the evolution of single‑cell transcriptomics, describing three core technologies—microfluidic valve chips (Fluidigm), fluorescence‑activated cell sorting (FACS), and droplet microfluidics—detailing how each compartmentalizes, lyses, and captures mRNA for next‑generation sequencing. He demonstrates rigorous benchmarking using NIST spike‑in standards to quantify sensitivity and technical noise, and compares method performance (FACS showing ~3× higher gene detection than droplets). Quake then introduces the Tabula Muris (later called Tabula Muris) mouse cell atlas, a collaborative effort profiling ~100,000 cells from 20 tissues across multiple platforms, highlighting how computational clustering recovers known cell types and reveals shared cell populations across tissues. He presents an analysis of gene‑set entanglement, showing transcription factors best define cell identity while surface markers perform poorly, and discusses how this insight guides systematic discovery of reprogramming factors. The talk also covers the Biohub’s open‑science policy (mandatory preprints, public data browsers) and its impact on accelerating research. Finally, Quake showcases applications: single‑cell profiling of cancer stem cells leading to the Quantacell drug‑discovery program, and a recent study of rare IgE‑producing B cells from allergic donors, culminating in the cloning of high‑affinity allergen‑specific antibodies and a proposed therapeutic strategy of swapping IgE antibodies for benign isotypes. The seminar ends with a Q&A on data integration, trajectory inference, and future directions.
Chapters
Welcome, welcome you all to the first KNI Distinguished Seminars Series. It's wonderful that we thought for the inaugural talk we will have previously one of us to come back to give a talk. So it's my great pleasure to introduce to you our speaker today, Professor Stephen Quake. Many of you probably know him well. He was actually a Caltech faculty here from 1996 to 2004. So Professor Quake has a very interesting background, and I thought I was talking with him to see how I should introduce him. I feel that I should introduce him in a way that can inspire young people. So you will see that if you are creative, anything is possible. So he came from— he got his bachelor's degree from Stanford University, double majoring in both physics and mathematics. Then he got his PhD degree in theoretical physics from Oxford University. And then after that, he went to Stanford to be a postdoc with Nobel laureate Steve Chu. And then he came to Caltech in 1996. First as a junior faculty and then quickly it became a full professor. And it's too bad that we lost him 2004 to Stanford again. So he has had a very distinguished career in his research. He has won many, many awards. I won't go through all of them. There's no time. But among them I would like to mention he was a Packard Fellow and currently he is already on the, he is the Packard board, the selection committee, yeah, chaired by Francis, that's right. And he is one of those very few scientists who are elected to 3 different national academies, National Academy of Sciences, National Academy of Engineering, and Institute of Medicine. So he is most known for his research in the areas of microfluidics, fluidics and then genomics. In fact, he actually pioneered this technique using microfluidic technology, applied that to biomedical research. Also, he was the first to develop single molecular DNA sequencing technology, and his research also these days focuses a lot on genomics. He is also currently running a $600 million organization is the Chan Zuckerberg Biohub. He said he will mention a little bit of that. It's a wonderful organization that's supporting fundamental science in bio areas. Anyway, so without further ado, let's welcome Professor Quake to give a talk today.
Thank you so much, Nai Chang. It's great to be back at Caltech. Spending the day on campus, I'm reminded what a special place it was. I got my start here and it really was incredibly influential for me in my career. In fact, I still identify with Caltech, I think, more strongly than any other place I've been at. I was very fortunate Caltech hired me when I was quite young and there were all sorts of stories that came out of that. The lady who ran the biology stockroom Could never understand. I was a faculty member. Every time I went to buy some supplies in the stockroom, she kept asking me, "Whose group are you in?" I'd say, "My group. Quake crew." And one evening, I was going into the lab, and one of the janitors was mopping the floor, and he said, "What are you doing going in that professor's office?" I said, "It's my office. I'm that professor." He just shook his head and said, "Well, they're getting 'em younger and younger these days at Caltech." There aren't so many of those stories anymore, and no one makes that mistake at all. But I still enjoy reflecting on it. So I'm gonna tell you today about some work that actually reaches all the way back 20 years ago to when I got started at Caltech. As I was putting the slides together on the plane this morning, I realized that there is really a continuous thread and story from my days here as a junior faculty member up to what I'm doing now, and I'll point some of the signposts for that out along the way of the talk. So I gave the talk this title to be a little provocative and to raise some hackles, but it really does sort of encapsulate a perspective that I and others have been pursuing for the last several years, and it's sort of a takeoff on a very long-running argument between biochemists and cell biologists. Let me— what did we decide, lecture? Seminar. Okay. So a long-running argument between biochemists and cell biologists, and this phrase, "considering the cell a bag of enzymes," is really kind of the fundamental abstracting principle of biochemistry, and it absolutely infuriated the cell biologists. Because they said that's too coarse of an approximation. The cell has all these complex structures and compartments, and it doesn't work unless you consider those. And the biochemists said, well, you know, you can actually learn a lot about how cells work by making this abstraction. And the debate— you know, I was looking up when it started, early '40s. And you can see that it kind of— the use of the phrase bag of enzymes waxed and waned over the years, reached its peak during the golden era of biochemistry. And I think the point is they're both right. It's useful to make abstractions. They're great organizing principles. It's useful to sometimes ignore some details, even though we know they're important in the big picture. And the whole field of biochemistry, I think, is evidence of that at some level. And the questions I've been interested in are thinking about the nature of cellular identity and cellular state. And what do you call a cell type? I think there's a little bit of arbitrariness in the usage of type and state these days. And we'll gloss over some of those differences. It's not been perfectly articulated. But if you ask, how do you identify a cell type, there have been many ways to do that through the use of the shape of the cell, or if cells look the same in shape, through the use of proteins they express on the surface and marking them there.. And those are all useful ways to do it, but are not perfect differentiators of cell identity. And you can sort of think about what would be sort of a thought experiment for defining cellular identity. And one of them would be to say, I'm going to enumerate all the molecules inside the cell and make a list of them. And this sort of does ignore structures, but I think most people would agree if you could do that and list every molecule in the cell at a point in time, That would be a pretty good way of identifying the state of the cell and its identity. It turns out it's a very hard experiment to do, of course. And so one looks for proxies. And it turns out one sort of reasonable proxy to consider is to try to enumerate all the RNA molecules, specifically the mRNA molecules inside of a cell, and use that as a proxy for cell state and cell identity. And that turns out to be a measurement that is these days pretty straightforward to do. It took a long time to get there, but— Now we can do it, and it's very easy to do. And it turns out, to cut to the punchline, to be a very powerful way to think about cellular identity. And that's going to be the theme of the talk today. So the way we read out and count all these RNA molecules is through the use of sequencing, next-generation sequencing. And Caltech is, of course, famous as the source of the first automated DNA sequencer, which was fundamentally based on automating analytical chemistry. And sort of the current revolution in DNA sequencing is based on taking a more biophysical approach to the problem. And the mental picture you should have in your head is something like this. Sequencer is a cross between a microscope and a dishwasher. And yes, it is. That's really the functionality. And the way they work is by anchoring molecules on a surface, flowing reagents over, and doing fluorescence microscopy of the molecules on the surface to read out their sequence. And it's no more complicated than that. And these very powerful sequencers that we use every day are simply automated optical microscopes that are taking pictures of a flow cell over and over again in between washes. And to say it in a little more detail, here's an example of how one does this on, for example, bulk samples. You take a piece of tissue. You purify the RNA. You turn it into cDNA. You then put it on the flow cell, which has been derivatized with oligonucleotides. And you do PCR so that each spot on the bottom of the flow cell is a colony of amplicons from a single starting molecule. And then you flow through fluorescent nucleotides and polymerases and measure the fluorescence, cleave them off. You get a bunch of reads. And it's now, on a medium-sized sequencer, hundreds of millions per run, which you can do in a day. And you map those reads to, for example, a reference genome and count gene expression that way. And so you're basically, for mouse or human, doing molecular counting in a 20,000-dimensional space. And this is, as I said, a very straightforward thing to do, fully commercialized. Lots of people do it. And to take that sort of technology now and apply it to single cells, requires but a small step. And the kind of experiments I wanted to describe today are all based on what we'll call ex situ single-cell transcriptomics, so cases where the cells have been dissociated and separated from their natural position in the tissue. There's also other ways to do in situ measurements, and Long Cai here at Caltech is one of the pioneers in that area on a smaller set of genes. But we've chosen to pursue this approach because it really lets you get a comprehensive picture So the basic experiment is to take a tissue, resect it, you dissociate it, and then you do this step, which I'll describe in more detail on the next slide, of compartmentalization, lysis, and capture of the mRNA and amplification. You do the sequencing, as I described it on the previous slide, and then you do a lot of computation on the data. And you've probably seen a lot of pictures like this from folks who've given talks about single-cell genomics, and the whole nub of the question is how do you— each cell, each dot here is a different single cell. And that cell sits in a 20,000-dimensional space because each cell has potential expression of 20,000 genes. And you have this vector with counts for each gene that happens to be expressed. And how do you represent that in a space that humans can picture is through methods of dimensional reduction. There's a lot of really fun math behind that that I won't get into. But this gives you an idea of how close or far apart the cells are in their 20,000-dimensional space. So and then you can ask questions about cells that are far apart, different identities, cells that have nearby identities, how do cells traverse from one identity to the next, and a lot of really fun science flows from that. So how do we do this technological step, this magic of compartmentalizing and capturing the RNA in the cell? —there's a bunch of ways to do that. And this is, for me, where the story began. So back in 1999, literally 20 years ago, we developed ways to make mechanical valves in my lab. And this was part of a long-term collaboration between myself and Axel Scherer and Francis Arnold. And we were interested in trying to find ways to automate biology. And these valves formed the basis of a company called Fluidigm, which built commercial versions eventually creating devices that would allow you to, in a very automated and controlled way, capture many single cells in parallel in separate compartments, add reagents to lyse them, to make cDNA, to do the amplification, and then to recover the material from the chip in order to sequence it. And that has been a very powerful way to do this, which we and others have pursued. Another way to look at single-cell transcriptomes is to use flow cytometry to sort the cells into 96- or 384-well plates. That's a fairly old technology, but very robust. And it's become possible to amplify transcriptomes, either in a large panel of genes or a whole transcriptome way, and analyze them. And that's something that has been, I would say, very gradually evolved, but is a powerful and useful way, and one that we continue to use today. And finally, there is the droplets. Again, something that dates back to my time at Caltech. Francis and I and Rich Roberts were mentoring a student named Todd Thorson who developed a very clever way to make microfluidic emulsions on a chip. And that sort of touched off a very interesting and thriving subfield of microfluidics. Rustem Izmagulov joined it in the early days. And technologies he and others and we developed have been incorporated now into devices that allow you to capture single cells in the droplets where they're lysed and the mRNA is captured on beads and the beads can be pooled and analyzed. And so that's also now something commercially available and very broadly used. And these are all very powerful ways to do it. They have different strengths. We use each of them in my lab, and I'm not going to— dwell on the differences, but I'm happy to chat about it afterwards. What I do want to spend a few minutes on is discussing kind of the technical properties of these measurements and sort of how well you can do. So this is now— the next couple slides are data from the fluid ion chips, but it's not so different than the other ones. What we have done to sort of measure the degree of quantitation is to use spike spike-in standards. And so you can get from the National Institutes of Standards and Technology, NIST, the same folks who define the length of the second and the weight of the kilogram, they've become interested in biological metrology. And they will give you test tubes with defined numbers of RNA molecules in them. So you'll get defined numbers and species. And you can use those as added controls in the experiment. So we do that as a spike-in for all of our— many of our single-cell experiments. So we're able to have an axis here that is in units of molecules per reaction. And then at the other side, you get out the units of sequencing, which are somewhat arbitrary. And I don't want to dwell on that here. But you can see here, these are now— each symbol is a different RNA species that was in the standard. They're present there in different quantities. And each dot is an average over 100 single-cell experiments. And you can see that over quite a large dynamic range, you can get reasonable quantitation in aggregate. You can also ask if you measure single-cell gene expression by two different ways, for example, by RNA-seq and by qPCR, do you get corresponding results? And the answer is more or less you do. And so that sort of validates the sort of more uncontrolled nature of the amplification sequencing as compared to the, I would say, better controlled qPCR experiments. And that has given us quite a degree— we spent a lot of time trying to understand these measurements. We're now very confident in understanding them, the sources of technical noise and so forth. And we and others have spent the last, I don't know how many years, applying these techniques to a variety of really fun problems in biology. And I'm going to pick a couple of these to talk about. Talk about in more detail for the rest of the talk, but this gives you a bit of a flavor of the breadth, not just for looking at transcriptomes, but for looking at genome sequencing and epigenetic states as well in cells. And I think maybe the last thing I want to say about kind of the technical aspects of this measurement are to say that we've also spent some time thinking about if we classify cell types by this transcriptome sequencing, how does that correspond to the classical ways of identifying cell type by physiology, for example? And do you get the same kinds of identifications? That's something that I think has been a little neglected in the field. We've done some work on that in my group in collaboration with Tom Sudhoff and Lichen Lo, in both cases looking at brain, in the one case of mouse. Where Tom's postdoc did electrophysiological measurements of the neurons, which is sort of the classic physiological way to classify them. We then aspirated out the transcriptomes and sequenced them to show that, yes, indeed, we're getting sort of concordant cell type identifications. And in the case of Lich and Lo, looking at a very physiologically well-defined set of neurons in the glomerulus olfactory receptor system in fly, and they feel like they understand those physiologically very, very well.. And we were able to show that we could resolve them through transcriptome sequencing. So this sort of method of classifying cell type does connect, I think, very smoothly to the way people have been thinking about cell type for hundreds of years, but one that's giving quite a bit more resolution and detail. So I'll just pause for one slide and tell you a bit about the BioHub and then come back to this theme of cell types and cell identities. So as Nai Chung mentioned, I recently was given the opportunity to create a new research institute in the Bay Area, and Joe DeRisi and I now lead that. We are working very closely with the 3 universities in the Bay Area: Stanford, UCSF, and Berkeley. And our sort of efforts are divided roughly into thirds, and about a third of our budget we use to fund faculty at the 3 universities, and we support the research of about 100 faculty members. We've also, in our bricks-and-mortar institute, built technology platforms, including a very powerful one for single-cell genomics to allow people who are not experts to have access to the technology. And we also have 2 major projects of internal research, one focused on infectious disease, the other on cell biology and the cell atlas. And I want to tell you a bit about that Cell Atlas one over the next couple of slides. And what we decided to do with the sort of resources we had here, which are much greater than any single professor or group could do, would be to really try to make an atlas of all the cell types in a large number of tissues in one organism. And so we call this the Tabula Meris, or the map of the mouse, and we've looked at 20 different tissues and organs of the mouse and done single-cell transcriptomics of all of them and done this as part of a very large collaboration with more than a dozen groups at Stanford and UCSF and now Berkeley who are experts in the different tissue types. And we've sort of tried to capitalize on their expertise in the biology of the tissues to help annotate the cell types and create what we think is going to be a very useful reference atlas, sort of a counterpart for the genome. But now one for cell biology. So we did this with 7 mice. And part of the fun here was that we took— from each mouse, we take each of the 20 tissues. So we know that the measurements are controlled for age, environmental exposure, epigenetic effects, and so forth. And we used both male and female mice. We looked at a total of about 100,000 cells. Most of the tissues were analyzed by both FACS and microfluidic droplets, and so we could compare the results of— we could sort of separate out the technical artifacts from each method from each other by looking at the effects that were common. And this sort of gives you a sense of the distribution of the number of cells across the tissues on the top for the cell sorting, on the bottom for the droplets. And as I mentioned, about 100,000 cells. This is all the same age, about 3 months old. And so as you can imagine, it's kind of challenging to get all those tissues out at the same time. And we had this very sort of fun period where every morning, this group of students and postdocs would show up at Tony Wiskurey's lab at the VA Hospital where the mice were held. They'd be sacrificed by his student Nick Schaum there on the far left. Then everyone was waiting with their ice buckets They'd take their organ back to their lab where they would do the dissociation and the sorting. And the plates were all brought back together at the Biohub where this group in the lower left did the amplification, the sequencing. And kind of the key technical folks at the Biohub— Spiros Darmanis is one of our young group leaders, Norman Neff who runs the single-cell genomics platform, and Jim Karkanis who runs the data science platform, and many, many other people. The total author list at the end of the day was about 80 folks. This gives you sort of a bit of a sampling. So as I mentioned, because we had done both FACS and droplets, we could do some comparisons between them. Here's one that's sort of informative. A very rough estimate of sensitivity of the measurement is to ask, how many genes do you detect per cell? And so here we show that number of genes per cell on average across a number of different tissues. Where the FACS is shown in green, the droplet in red, and an independent measurement made by a group in China by Guoqi Guo using so-called microwell-seq is shown here in blue. And you can see that this FACS sorting is far more sensitive than anything else, about a factor of 3 more sensitive by this metric than droplets, and substantially more sensitive than microwell-seq. And so you may ask, why did you do every— why don't you do everything with FACS? Why don't you ignore the droplets? Well, the droplets allow you to have much higher throughput and are logistically much easier to do. And the data rolled off of that months before it did off the FACS. And so the droplets, even though it's lower sensitivity, allows you to do more cells and get the data more quickly. And there's cases where that's useful and helpful. So I mentioned we had the participation of the various tissue expert groups. And they went through this sort of very fun process here to do the dimensional reduction that I described earlier on each tissue. So for each tissue, we looked at the relationship of the cells to each other. And you can see, you cluster them in the high-dimensional space, look at the visualization in the lower-dimensional space, and you can see that they're separating nicely into different cell types. You look at the genes that are differentially expressed in each cluster. The tissue experts would go in and look at that and say, this makes sense or it doesn't. I think I can name this cell type. This might be a new one. The vast majority of the cell types were already known. And by having that kind of expertly curated annotation, we sort of have something that we would say very close to ground truth and a way to test automated annotation techniques and questions where we just turn the computer loose on the data without any prior biological knowledge. And that's been a very useful aspect of this. So here, each tissue is annotated independently by experts. If you put all the cells together in the computer and now ask the computer to say, I want you to cluster them all and separate them without knowing anything about biological knowledge— we'll keep the expert annotation secret— just based on those gene counts, it can do it. And you can see here that it actually does a pretty good job separating out the different tissues. So that each dot is a different single cell, each color is a different tissue. And you can see we put on top our expert annotations when they correspond to a cluster. And most of the clusters are pure tissues. Some are not, and I'll come back to that in a minute. And so what you can do is ask, all right, let's compare each of these clusters here with the— and the members of them with the expert annotation of the cells that was done separately. And then, so you can have the cell ontology here, the clusters done by the computer here, and you can see that things are separating pretty well. But there are some clusters which contain multiple cell types. And you can't read any of this text, but I will zoom in on the next slide here and show you a few of those in higher resolution. And sure enough, those are indeed the same cell types found in different tissues. So one cluster here, the top one, are all T cells found in different tissue. Another cluster was endothelial cells, cell type shared across tissues. And the bottom one are B cells. So it actually does sort of work out that the computer is able to not only find differences between cell types, but find identical cell types that are shared between tissues based solely on looking at that 20,000-dimensional vector of RNA counts. So you can then ask questions about what's the minimal amount of information you need to define a cell type. So you can look at our expertly annotated cell ontology and sort of cluster them together by— build a phylogenetic tree by whatever relationships you want. And then you can take some subset subset of the genes or all of the genes and say, I'm going to cluster the cells and try and determine cell type in the computer using only a subset of genes. For example, in this case, using only transcription factors and their expression. And that gives you a set of clusters of cells and cell types. Then you can ask, how does that compare to ground truth? And you can see where things align and whether they align or don't. And you can compute something called the graph entanglement, which tells you sort of how similar these two phylogenetic trees are. And it's a bit like golf. The lower the entanglement, the better you're doing. And you can repeat this with different sets of genes. And this is sort of what you see across that. And so— I'm sorry, maybe you can't read the text. I'll read it off for you here. This is entanglement, and these are the sets of genes we use for different experiments. So this is the transcription factor experiment. And you can see it's the lowest entanglement. So the transcription factors— do the best job of any subset of gene types in defining cell identity. And that's perhaps not surprising when you think about what they're there for, right? They're controlling the master regulatory apparatus of the cell. And however, what is surprising to me, or what surprised me here, was the worst performing group of genes was cell surface markers. Huh. That is kind of the default way of separating cell types in facts and whatnot, and it turns out that it is not as informative as perhaps using other mechanisms. And let me show you a final example of that. So this group right here, which is almost as good as transcription factors at defining cell type, is catalytic activity. And so maybe what one should be doing instead of making antibodies against surface markers to define cell type, people should be making fluorogenic substrates that are reflecting different catalytic activities within the cells as a better way of defining cell type. And that was kind of a fun potential outcome for that observation. So we spent a lot of time digging down in the transcription factors and trying to classify cells purely based on transcription factors. And they did work the best, and they have this very powerful application in reprogramming. And so if this all really made sense, you should be able to rediscover reprogramming factors through this, and we did. So for a given cell type, we can ask which transcription factors end up being— contributing the most information for specifying the cell type. And in many cases, we rediscover known reprogramming factors. But this also very systematically gives us a whole new set of experiments to do and potential ways to program and reprogram different cell types because many had not been known before. And this, I think, is hopefully going to provide a very systematic and global foundation for expanding the number of cell types that can be programmed or reprogrammed. And I have one more slide on transcription factor specificity. Within a given cell type, you can see the use of different transcription factors, which will specify— or specifying things— that cell type in different tissues of the body. There's just an enormous amount of really fun nuance and detail to explore. And rather than spending the rest of the talk going into that, I thought I'd tell you a little bit about our philosophy of doing science and how it applied here, and then in the remainder of the talk, I'll tell you about some other things we've been doing in my lab. So our donors, Mark Zuckerberg and Priscilla Chan, challenged us to find ways to accelerate accelerate science, and we decided that one of our hypotheses was we could accelerate science by accelerating dissemination of information. And so we've taken a pretty aggressive policy about publications, and both for our internal research and everyone we support, people have to agree to use bioRxiv or other preprint servers to share their results on the same day that they submit them to a peer-reviewed publication.. And the hope is that that's going to accelerate science because you'll learn about things sooner and be able to work on them. And we put that into practice here in our first big project, the BioHub. I'll sort of just show you the timeline. So this was— we were kind of flying the airplane as we were building it. Joe and I were the first two employees in October 2016. And our headcount of employees has been gradually increasing. We're now kind of at a steady state. But we began working on this project almost as soon as the lab opened. And we were ready to submit the paper after our first year of operation. And we put it on archive. And then we eventually— it was published in Nature about 6 months later— almost a year later, sorry. And the microwell stuff came out in the interim. But in this whole gap where normally you wouldn't have access to the paper or the data. The whole world did because we put it on Bio Archive, not just the manuscript, but all the data. And the week before the paper published, I went back onto Archive to see sort of what the effect was. And the abstract had been read almost 20,000 times. The paper had been read 8,000 times. That is, I think, virtually every cell biologist. I mean, if you look at the ASCB, that's roughly the membership, I think. People— a lot of people got to look at this, and so we felt good about that. The raw data itself had been downloaded 1,657 times, and so many people were using it. And in fact, people began to publish our data before we did. Yes. That made me a little uncomfortable at first, and then I realized that's sort of exactly the way this whole thing is supposed to work. Work. So we really did accelerate science. Here's two examples of very prominent papers where they used our data for purposes other than we were publishing it, but in which they needed it to get the data to get the papers published. And, you know, Sten Lindersen told me that, you know, they couldn't get the RNA velocity paper past the referees without using all of our data to show that it was very general across tissues. And so this is one example showing that, yes, you know, I think this sharing really does have the potential to accelerate science. If you're not an expert and you want to get access to the data, we created a browser so you can search for any gene you're interested in and any tissue. And this is the link for it. It's a lot of fun to play around with, and you can generate these plots that show you the cell types in the tissue and, within a given cell type, the intensity of gene expression for any gene you're interested in. You can also see it more quantitatively with various graphs and numbers and things like that. That's proved to be a very useful way for people to get access to the data, and they've been using it in ways that we didn't anticipate. And it's been fun to kind of see all that happen. So that's where we are with our cell atlas. We've had a lot of fun doing it, and we think there's potential to create parallel resources in other organisms, and work for that is underway. Both at our institute and others. And, you know, I think this is all creating sort of very powerful resources for cell biology, and it's going to be a very exciting decade for the field. I'm going to tell you now a little bit about some of the practical applications of these single-cell transcriptomes, the first example in drug discovery, the second in immunology. Soon after I arrived at Stanford, Mike Clark moved from Michigan, and he got a hold of me and was interested in using single-cell transcriptomics to analyze diversity in human tumors. And Mike had the distinction of being the first person to identify cancer stem cells in solid tumors. People had found them previously in tumors of the blood, like leukemias, but had not done it in the more common tumors like breast, and colon, and so forth. And Mike had developed very powerful ways to do that. But he knew that the purifications were not complete. They were enrichments, and wanted to get sort of finer scalpels into understanding those populations. And so we began to do that. First paper was in 2009. In this case, in that first example, we were looking at trying to understand why cancer stem cells are radiation resistant. Turns out it's because they're overexpressing reactive oxygen scavenging genes. And then we moved on to sort of characterizing tissues, both normal and tumor. Here is the human colon using single-cell qPCR. So each row is a different cell. Each column is a different gene. Here we were using Fluidigm's early technologies, the BioMark, and you can see very clearly different patterns of gene expressions for the different cell types in the normal. Tissue. And then as you look at the tumor, you see it's all messed up. There's a lot of heterogeneity there as well, but not in the same proportions. Some cell types are missing. Some are expressing aberrant genes. And we got the idea this would be a very sort of powerful way to discover new potential therapeutic targets. The cancer stem cells are a very important one to try to kill in any therapy. And we wanted to find genes that were uniquely expressed there. We founded a company to do that called Quantacell back in 2010. And that was sort of the plan— discover targets for oncology therapeutics, develop small molecules against them. And we went out and did that. And so we looked at a variety of tumors, including glioblastomas, found the different populations, found genes that were differentially expressed there. We could show that if we knock down those genes, they would reduce the representation of the population, and then began to look at what happened as small molecules were developed. And if you develop a small molecule against the targets we were interested in, we could see the populations changing. We used a lot of xenografts and could see that it sort of would validate those molecules and those targets. In animal models. And it all did sort of work. It turns out to be really tough to make drugs. We were— Quanticell was acquired in 2015 by Celgene. Celgene was acquired earlier this year by Bristol-Myers. And two of the molecules we developed are highlighted now by the joint company as promising ones in their pipeline. In early phase 1 trials. Remember, now we're almost a decade into it. We still don't know if they're going to work, but hopefully we will in the next few years come to some understanding of whether this has been worth it in the end. It's a long story. It's given me a great appreciation of how challenging it is to develop real therapeutics. For the last little bit, I'll tell you a more recent story without the benefit of time. We're really at the very earliest stages of it. And— but we have high hopes. So another sort of Caltech connection here, my baby girl who was born here down the street at the Huntington Hospital turned 17 yesterday. Boy, that went by fast. And what we discovered in the first couple of years of her life was that she had a life-threatening peanut allergy. That got me interested in— in the immune system and how it goes awry in these situations. And for Zoe, she was eventually desensitized thanks to Kari Nadeau, who's a clinician at Stanford who's been helping pioneer ways to mitigate allergies. And Kari runs a very active clinic at Stanford with a bunch of fun trials. And we began to get interested in trying to understand the bad antibodies that cause allergies. There was a quick immunology primer. There are different types of antibodies, different flavors or isotypes in your body. The ones that cause allergies are called IgE, and they are pretty much useless for modern humans. Their original function was to control worm infections. Very few people in the developed world have worm infections anymore, and so pretty much their sole role now is to act as a hair trigger causing problems and allergies and asthma. And the cells that make that— B cells make antibodies, and the B cells that make IgE antibodies are very rare. And it turns out that they had never actually been purified before from humans. And so we decided to try to do that using these single-cell approaches. So now instead of going after heterogeneous tissue like a tumor, we're going to go after a very rare cell type. And try to understand it. And the way we did that was, first of all, using individual humans who have extremely high levels of IgE. So folks with food allergies have IgE levels a couple orders of magnitude higher than people without allergies. And they have correspondingly higher levels of IgE-producing B cells in their peripheral blood. One of the key things here was proper choice of donor here. Purify the B cells, do the sorting. They're still very rare. And we used very loose gates to get enrichment of IgE-expressing cells and ended up doing single-cell sorts, sequence the transcriptome, and then sort of post hoc identify what kind of cell was that really. Was it IgE? Was it IgG that had some nonspecific binding to it? And so forth. And we discovered that you really shouldn't trust those FACS gates on their own, because they're giving, in many cases, enrichments, and it's a little risky to call them entirely pure populations for a variety of technical reasons. So we did that, and let me share some of the data with you. So we looked at about 100 IgE cells at the end of the day, but also sorted other isotypes here. And so we could look in these individuals at the transcriptomic properties across a variety of isotypes. And one of the first things we noticed is that for the other isotypes, the vast majority of cells were either naive or memory cells, so sort of passive in terms of producing antibodies. The IgE cells were predominantly plasmablasts. So they're little factories cranking out antibodies. And you can see kind of in the dimensional reduction here across all the cells that they very clearly separate into the two groups. You can look at sort of some of the key genes and how they're expressed in each group to be confident that you're identifying plasmablasts on the one case and naive and memory cells on the other. And now if you look at the proportion of each type here, for all the other isotypes, predominantly naive and memory, For IgE, predominantly plasmablasts, for reasons that are a little unclear, but probably not great for the health of these individuals because these are, after all, producing the bad antibodies. As we analyze the sequences of the antibodies produced by these cells for the IgE, we can see that the diversity is similar to the other mature isotypes, the ones that have gone through class switching. And you can measure that a bunch of different ways. You can look at things like mutation frequency, which is in the upper right there, and IgE is the second from the right on the list there, and it is comparable to the other mature isotypes. You can look at the usage of the light chains, shown here. You can look at things like, within IgE antibodies, relative mutation rates between heavy and light chain, you can look at CDR3 length, and so forth and so on. Provides a very kind of interesting and detailed picture of the fundamental biochemical processes that created these antibodies and the diversity of them for this rare class. So what we then began to do is look to see— look for relationships between the antibody families. And in fact, we found an example of a case where two individuals were making a very similar IgE antibody, so close that as you start building trees, the computer clusters them together into the same clonal family. That's clonal family 1 there in the upper right. And the shapes here correspond to different donors. And you can see that a very similar antibody being made in two different people. It's an example of convergent evolution that is very rare. We've looked for that in many other situations in immune repertoire sequencing. And it's very hard to find cases where the same antibody is being made by two individuals. And so we began to look at those. There must be some powerful reason to do that. This is an example of some of the convergence in the sequence. You can see that they're also very highly mutated, very much on the tails. This is the distribution of mutation frequencies across the different cells. And they're enriched in mutations causing substitutions. So we cloned and expressed these antibodies, synthesized the genes, had them expressed by a vendor, and began to measure their binding properties. And perhaps not surprisingly, they bind very strongly to the allergen. So these came out of two individuals who are allergic to peanuts. There's sort of three famous allergens or epitopes for peanuts, Ara h1, h2, h3. And from this family, clonal family 1 of related antibodies, these 6 all bind very strongly to Rh2 and cross-react to Rh3. And so that's pretty interesting. I mean, if you pull a random antibody off your body, out of your body, what are the chances it's the one that makes you sick? In this case, we were able to zero right in on it, and that's provided kind of a very powerful way to discover we can discover human antibodies now to a variety of different food allergens as we march through different donors with different food allergies. Now, we began to measure the binding constants to both of those antigens and discovered something sort of interesting as we began playing around with the sequences. So that blue dot there represents sort of the best one, and you can see it binds extremely strongly to Rh2, also pretty well to Rh3. Now, as you start to change things around and swap out sequences, you can do things like switch the light chain to a random other light chain that came from somewhere else, a non-PNUS-specific antibody. That completely ablated the binding. So without the proper light chain, it doesn't work at all. You can sort of revert the sequences to the germline sequence. So imagine there were no mutations at all. That's shown here. So you get a little bit of binding. You can see that there is something around a few times 10 to the minus 9th against the primary antigen and nothing— almost nothing against the other. And now as you start adding in mutations, to either the heavy or the light chain, you can see that the— you recover the specificity and the binding constant. And as you start to engineer things a little bit, you can make things even stronger than the— in cross-reactivity than the purified sequence. So this is something that we think could lead to a very powerful therapeutic strategy, and that is if you can take these human-derived antibodies and express them as a different isotype, one that's not a bad isotype— IgE is a bad one— if you make them as something else like IgG4, you can, in principle, inject them and have them swap out the IgE antibodies and compete for the antigen. It sounds like a little bit of a crazy idea, but it's actually not so crazy because remember, IgE is the rarest of the antibodies, and it's actually at a pretty low level in your blood. So you actually don't need to have very much in there in terms of the pharmacodynamics in order to compete them out on binding. And Regeneron has done a very interesting proof of principle experiment experiment to show that this might work. They used their humanized mouse system to make antibodies against cat hair whiskers and then injected them into humans that have allergies to cats. And the claim is— this is their published claim— that they reduced the incidence of allergy symptoms. And so it's a very kind of suggestive proof of principle that this approach might be general and useful. And in the case of Food allergies, it would be particularly useful because what happens with desensitization is the immunology is still a big mystery around the whole thing. And so you can, by a variety of means, get people desensitized, but they have to expose themselves to the allergen very frequently, every day in many cases. And so in the case of my daughter, she eats a peanut M&M every day, and the worry is if she stopped doing that, the allergy would come back. And, you know, in about half the cases it does and half it doesn't, and the reasons why are a mystery. And so there's, as you can imagine, compliance issues and everything else with that. So an approach as the one I described here, in principle, would mean you could get an injection 3 or 4 times a year that would immunize you against the antigen, and you could eat whatever you wanted. You could eat the antigen, you could not, and it would really be— a much different approach to managing these allergies and one that we're excited to explore. So with that, I'll just— oh, and I should acknowledge Derek Crute, who is my student who did the work on that project, with our collaborator Kari Nadeau. So I think I'll wrap up here and take questions and sort of bring you back to the variety of things we've done over the years here, and I'm happy to discuss any of them if they catch your eye.
Thank you. Thank you very much for this very nice talk. Okay, so we have time for questions.
I see hands. Okay. Thank you, Steve. So for the first part of the talk, when you cluster the cells, cell types, that dendrogram that you showed, does it tell you something like about like a Waddington differentiation path? Like, can we infer something about how these cells become each cell type? Yeah, that's a good question. So the question comes with specifying cell type. Able to infer it by what's expressed by the mature cell types. We see many of the progenitors, and we can, thanks to our expert annotators, have a sense of which are the progenitor cells. And can our algorithm sort of draw the connections there? We haven't tried to do that explicitly. There are computational approaches to do that that will kind of do pseudotime trajectories by measuring those relationships. I think in principle that information is in the data. We haven't tried to tease it out quite as of yet, but you're welcome to try, and I think you'd have a good chance of success there. Steve. Yeah, Peter. Great talk. Thanks. So in your— you discovered that transcription factors are important, right? We knew that. That was known all hypothesized. The 5,000 genes that are— Yeah, right. Yeah. How many are transcription— what does it take to run a cell? Well, I think there's a total of maybe 400 transcription factors, and you use a small fraction. I mean, the ones to specify, it's like half a dozen to a dozen. And the bottom half of that list are adding minimally to the list. I mean, the experiments of people who do reprogramming, 3 is often enough to convert, for example, a fibroblast to a neuron. It's sort of a neuron, but broadly speaking, it doesn't take very many to change identity.
[Speaker] Question on the end. What's the correspondence between that graph statistic, your 0.11, and some sort of predictive accuracy?
Like, is 0.22 twice as bad as 0.11, or is it nonlinear in some sense? [Speaker] The entanglement? I suspect it's not a linear scale, but I'll have to get back to you on that in the end. Do you homogenize tissue before sequencing? How much variation do you have? Do we homogenize the tissues? Well, we're trying to keep the cells intact, so we're dissociating them with the hope that they're remaining discrete entities. And it is sort of different for every tissue. This is one of the pieces of experiment experimental expertise that the tissue experts bring in. They're sort of tuning their dissociation techniques for their tissue. And it is, frankly, probably one of the more uncontrolled aspects of the experiment. And it's known that different cell types will lyse or dissociate at different rates. And so, you know, I wouldn't put too much confidence on the relative amounts of different cell types within each tissue because they can be differentially responding to the dissociation. And that's one of the reasons why it's useful to do in situ measurements, because you can get absolute numbers that way. But yeah. Yeah. So in your IgE-producing B cells, have you looked over temporally the difference in those humans with respect to either some type of treatment is given or not?— for the IgE. Yeah, we haven't done that yet, but Kari has the cohort. So she— these were, I believe, treatment-naives, so they hadn't been desensitized yet. But yeah, she's got all the longitudinal samples, and, you know, one of the reasons for doing this is try to understand why some people can stop eating the peanut every day and others can't, and try to tease some of those effects out. But to be done. We have one question. Yeah. Steve, do you think you'd be able to use the same tabula meris approach to do single-cell chromatin accessibility assays? Yes, and Jason Dury has done that. That was, I think, one of the papers I flashed up. Absolutely. Yeah.
Steve, you have this amazing combination of two data sets for the same or very similar cells with two methods. So I have two questions related to that. If you cluster the cells based on one method or the other, do you get identical maps or some maps because presumably they have different biases?
And related to that, is it possible to mix and match datasets and still get meaningful information? Or do you have to do everything the same way to extract information? Yeah, so to your second question, it is challenging to mix and match. This has been kind of an outstanding computational problem. There's been a few, I think, pretty reasonable approaches to that recently. Sarah Tyquin has done one, and the other, I'm forgetting the origin. And we've been playing around with that at the BioHub, the data science folks. And they're feeling pretty good about it. So they're working to some level. I'm not sure I totally trust it, but there's some degree of solution there. As far as comparing, here's an example of if you ask what are sort of the core genes that are defining cell type across some of the tissues here, this shows the Venn diagram between the facts the 10x, and the microarray seq. And you can see between the two methods we use where we've got same mice, everything controlled, it's pretty good, not perfect. And you can sort of see the FACS tends to have higher sensitivity. And the microarray seq, there's always an overlap. So there is, you know, even in experiments done in completely different mice, totally different way, other side of the world, you know, there are some shared core genes defining them, and we're finding that. Maybe are the ones with certainly the highest biological confidence and the most robust expression.
Yeah.
There are many different ways of creating a tumor in a mouse.
Can you say something about which is the best way using single cells?
Create a tumor in a mouse? Right. Yeah. So we had a sort of very strong philosophy of working with human material. And so we'd use the mouse like a Petri dish and make xenografts. And so human tumors would be taken out of people in their surgeries, and if you implant the human cells in the right mouse, they'll propagate. And so these weren't mouse tumors. They were human tumors being propagated in mice.
I have a question about the IgE antibodies. So you showed some of the— Most of the human IgE antibodies that were cross-reactive, so they're cross-reactive, are Rh1, Rh2, and Rh3.
Do you ever find antibodies that were specific, that bound just like to Rh2, 1, or 3? Yeah, not all are cross-reactive, for sure. And we started to now do comparisons against other allergens and other antibodies we purified, and you tend not to find broad cross-reactivity. Sometimes there's a couple, sometimes they're just the same. Single antigen. Yeah.
Do you have any idea of what the cross-reactivity is going to mean in the context of allergy development?
Yeah, it's a good question. We don't know. And it's a bit surprising because the epitopes aren't very similar. And so you wouldn't expect there to be that much cross-reactivity. And that's one of the mysteries we're going to unravel going forward, I hope.
Any other questions? Otherwise, we have a very nice reception outside, so you guys can chat with Steve again.
Thank you very much.
More from Joshua







Scientist Stories: Hans Waterham, The value of phenotypic assays in peroxisomal disorders




Scientist Stories: Joel Zlotogora, Genetic carrier screening programs for reproductive purposes