Scientist Stories: Sylvia Plevritis, Cancer Systems Biology
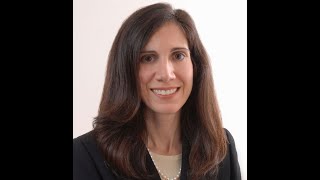
In this Distinguished Seminar, Professor Sylvia Plevritis (Stanford Biomedical Data Science) presents her lab’s interdisciplinary approach to decoding the tumor microenvironment (TME) using single‑cell and spatial technologies. She frames the need for biomedical data scientists who can both apply and define questions in precision oncology, emphasizing data engineering, statistical modeling, and deployment. The talk highlights three core computational tools developed in her lab: Phenostamp (modeling cell‑state transitions and EMT/MET plasticity with Markov models), Remy (partial‑correlation based reconstruction of ligand‑receptor interactomes from bulk and single‑cell RNA‑seq), and Celesta (fast spatial cell‑type assignment for CODEX multiplex imaging). She demonstrates each tool with experimental validation – e.g., mapping intermediate EMT states in lung cancer cell lines and patient samples, identifying CTGF‑LRP6 fibroblast‑malignant crosstalk linked to stemness, and uncovering CXCL10‑CXCR3 mediated T‑reg recruitment in node‑positive head‑and‑neck cancer. The seminar also covers practical aspects of data governance (IRB, de‑identification, secure environments) and the training model that pairs computational scientists with cancer biologists to foster interdisciplinary fluency. The talk concludes with reflections on the importance of diverse, collaborative communities for advancing cancer systems biology.
Chapters
Distinguished Seminar Series. Oh, so, okay, so good afternoon everyone and welcome to the Distinguished Seminar Series of Cambridge Center for Eye and Medicine. I'm Michela van der Schaar, I'm the center director, and it is actually my great pleasure because today we have Professor Silvia Plevritis that is going to give a talk in our seminar, and this marks more or less the 1-year anniversary from the time we started the center. And I'm especially happy that Silvia is the person giving the talk today because she represents very much what we aspire to. She started with a PhD in electrical engineering from Stanford University and moved all the way to becoming a prominent researcher in biology of cancer research. And this is something we all as a center aspire to, to really build this interdisciplinary cutting-edge research agenda as Sylvia has done. She's a professor and chair at Stanford's Biomedical Data Science Department. She's also a professor of radiology at Stanford University and the program director of the Stanford Biomedical Informatics Graduate Training Program. She leads a computational biology cancer research program that bridges genomic, imaging, and population sciences to decipher the properties of cancer progression and treatment response. She is a fellow of the American Institute for Medical and Biological Engineering and a distinguished investigator in the Academy of Radiology Research. She serves on the National Cancer Institute Board of Scientific Advisors. She is the program leadership committee of the Stanford Cancer Institute and the leadership council of the Stanford BioX program. Also, Sylvia is one of the scientific advisory members of the scientific board of the Cambry Center for Eye Medicine. So we are very fortunate to have Sylvia today to tell us about her research, and it's an opportunity for us all to learn from her how to cross from one discipline to another and really build transformative research. Thank you, Sylvia, for joining us.
Well, thank you for that kind introduction, and I'm really delighted to be with you and to learn more about your center. I think what you're putting together is really exciting and important and will drive the future of cancer research and just systems biology research as I'll describe it in my talk today. So I'm going to put my slides up, share screen. Okay, so do you see my slide?
Yes, we can.
Okay, terrific. So I will focus today on work in my lab on reconstructing cell-cell interactions in the tumor microenvironment. This is a picture of the Clark Center at Stanford University, and it was really designed as an interdisciplinary research center. We have members of the center come from the School of Medicine, Engineering, Humanities and Sciences, and it literally is at the crossroads between these different parts of the campus. I'm just really grateful that I have the opportunity to have my lab within the Clark Center. I wish we could be working there more. We actually look— for the experimental scientists, they are working there, and they have been working through the pandemic, but not for the computational scientists. So I want to start by just making a few broad comments on my view of data science in the area of cancer biology, and I really believe that moving forward, forward in the domain of precision oncology in particular relies on leveraging big data and analyzing it with novel computational methods, and by big data I mean real-world data, multi-scale data, longitudinal linked data, and so we definitely need scientists who understand how to analyze big complex data and scientists who know how to develop analytical methods, but we need them to work within a domain and data within the specific domain of cancer biology and cancer outcomes. And I would say that, that the frontiers of data science, and as I view it, are— there's many different frontiers, and the first order is relates to actually getting access to the data and being able to work with the data. And that involves building common data models, really thinking about privacy and security, software interoperability, and data storage and high-throughput compute. And a lot of these aspects are, you know, very much in the domain of, I would say, data engineering. Second-order considerations, once we are able to work on big platforms with big complex datasets have a lot to do with applying analytical models to these data and really how to interpret the models, understanding algorithmic bias, understanding the performance in terms of what's the gold standard, how to benchmark the data, how to quantify the uncertainty, and then how to develop these algorithms so that we can learn adaptively? And then finally, how do we actually deploy these algorithms for adoption within the context it was really designed to do? And so this is, I would say, more in the area of statistics and maybe also computer science. But we have folks in the— in our department, biomedical data science, who span these two different orders of research, let's say, within biomedical spectrum coming from backgrounds in engineering, statistics, informatics, and computer science. But I would like to talk about expanding the role of the biomedical data scientist, and one in such a way that we're trained enough within the domain context to actually define the biomedical question. And what I mean by that is instead of being the folks who are pursued by, let's say, the clinician or the oncologist or the molecular biologist who have the driving biomedical question and come to us and say, could you help me? I have this complex data. I don't really even know how to access it. I want to answer this question. I really believe this data is going to solve this problem I've been trying to resolve. That's important, and we have to play that role. That's no doubt, and that's the most traditional role. But I feel now with so much data at our fingertips, we can also think about defining the question. And I think that's important because we can identify questions that folks who aren't trained in data science may not know how to ask. They don't— this is a question that they're not necessarily thinking about because they don't really know the analytical methods that can be applied to their data. And so I feel that this beckons us to really work creatively, not only at the data and methods domain, but at the data methods and domain interface, and requires to understand the domain in a much deeper way. And so I will tell you a little bit about the work that we're doing in my lab. I have tried very hard to work with young investigators in my lab in this context to help them be PIs of grants so that they are writing their own NIH grant and identifying the biomedical question. So with that, I've built a lab in the Clark Center that has— that's a dry lab, computational lab, and as I alluded to, has expanded to a wet lab. And so Why did I do this as a PhD trainee in electrical engineering? I did it because when we were working in the area of answering people's questions when they gave us the data, we would often find things in their data that were not of interest to them and yet seemed very exciting to us. And I just needed to figure out a way how to validate those findings. And so I was very fortunate that I was able to get access to wet lab space. And, and this was a challenge for somebody with my background to develop, but it was a challenge I was really willing to take on. And, um, and as our, uh, work evolved, we were not just validating, um, our, uh, analyses, but we were actually developing new experimental approaches to identify questions that we started becoming interested in. So I have a lab, we call ourselves our Cancer Systems Biology Lab, and we have folks who come from statistics and computer science and cancer biology and immunology. And the goal has been in the lab to identify projects when folks come into my lab where they're partnered projects, that they work with somebody who's maybe more computational and more experimental than they are so that they can do something quite unique when they're in the lab, but do something that can be completed within 2 or 3 or maybe 4 years. And so that also is challenging to sort of, you know, do novel first-authored research within this space because it's so complex. And so it really requires understanding really how to define a problem that can be sort of executed in a reasonable time frame. So with that in mind, I want to tell you about the context that my lab is primarily focused on. We are very interested in trying to understand aspects of the tumor microenvironment associated with cancer progression and drug response. And we all know the tumor microenvironment is consists of cell types that are not just malignant cells, but there is a whole plethora of cell types that are immune cells. We know with cancer immunotherapy how important that is. And there are stromal cells that we really don't know that much about, and my lab is very interested in characterizing the stromal cells and their role in the tumor microenvironment. And, of course, endothelial cells that also really are important in tumor microenvironment. So when we look at these pictures of all these different cell types, we ask ourselves, how are they really interacting with one another to facilitate initiation progression of the tumor and to modulate its response to treatment? And so we're so lucky that we're able to work on this question because we now, all of us, have access to really exciting platforms with single-cell analytics, ranging from looking at the transcriptome at a single-cell level, now resolving tissue with imaging platforms, whether it's spatial transcriptomics or spatial proteomics, with single-cell resolution and even sub-single-cell resolution, and even looking at the proteome, which we've had, you know, technologies like CyTOF now for 10 years, to look at single-cell data. And so with the single-cell data, folks who have an analytical background are like so valuable because it is absolutely essential to be creative in how to tackle the analysis. And in my lab, we have been using all sorts of tools relating to identifying networks, reconstructing networks associated with interactions between cell types, and I'll talk mostly about that today. We've also done work with trees, reconstructing trees to think about lineages, and we know, for example, developmental lineages like hematopoietic development, we've studied that a lot with these tree-based approaches. In terms of normal biology, but we've been also using them to look at kind of lineages within the cancer cells, and I'll talk a little bit about that. We've also applied models to try to understand dynamics, Markov modeling, to think about cancer cells changing cell states and asking questions like, what is the transition rate between one cell state and another cell state. I'll talk a little about that today. And of course, we've been applying machine learning algorithms that put together the complex datasets, mostly for purposes of prediction, but also for purposes of telling us important features by embedding the data into lower-dimensional spaces that enable us to try to draw inferences about interesting hypotheses that may be relevant to the process that we're studying. So I'm going to focus today on really 3 different tools or approaches or mindsets that my lab has developed to study the microenvironment given these platforms I just mentioned. And one is called Phenostamp, where we have published a paper to look at cell state transitions and try and understand dynamics. Another one is a tool called Remy that specifically takes transcriptomic data and tries to reconstruct cell-cell interactions and make hypotheses about global interactions. And then finally, the last tool, Celesta, which takes this further by trying to resolve interaction in a spatial context with spatial information. So let's talk a little about Phenostamp. But before we talk about Phenostamp, which is focused on looking at cell state transitions, I want to introduce, to those of you may not be familiar, this concept of plasticity, specifically as this applied in cancer. We know a lot of cancer datasets and questions of progression really focus on clonal evolution, what, you know, driving mutations are picked up and passenger mutations are picked up as the tumor evolves, and that's really critical. But even within isogenic context within a, you know, a fixed mutational background, the cancer cells have different behavior because they have epigenetic variation, and through that variation have differences in drug response, and they respond to their environment differently, and they impact their environment differently. So even within the same genetic background, there is a layer of variability in how cancer cells behave that is epigenetically regulated. We call this plasticity. One particular example of this is this epithelial to mesenchymal transformation, which we definitely see in cancer cells in vitro. In culture conditions, we can see cancer cells that have a more epithelial phenotype where they have tight junctions, And they can be driven into a mesenchymal phenotype where they have now dissociated and they're more migratory in behavior. And when you drive them between these two different phenotypes, we know that their response to drugs varies. But what's interesting in this area of EMT is that more and more we recognize that it's not— maybe the most important states are not necessarily the epithelial and mesenchymal states, but actually the intermediate states, which is like a combination of these different features where individual cells have some fraction of an epithelial and mesenchymal phenotype. We think that this particular intermediate states may be what is more physiologically relevant. As cells are being driven into this epithelial to mesenchymal state, we also know that they can be reverted back from mesenchymal to epithelial. To epithelial. And this concept has always fascinated me, and so I thought as a modeler who has an analytical background, can I or can my lab do something to try to tease this apart more with analytical models? And so, and we were really motivated because we know that this concept of EMT has been actually discussed in the literature, not only in terms of drug response but also in terms of metastasis. The, and the concept is that the cells start as very epithelial cells at the primary tumor site and then take on some mesenchymal, partial mesenchymal feature, and that enables them to leave the primary tumor site, traffic through the vasculature and then re-establish colonization at a remote site and re-establish their more epithelial characteristics. So this is a model that people have proposed and used, but it's very controversial, and there has, you know, been papers that say this is actually not how metastasis works. And so it's an ongoing controversy, and we thought maybe if we could build a more mathematical description of this, we can help resolve the controversies in this field. Questions we started with are, can we define intermediate states, EMT states, in a well-controlled in vitro cell line experiment? If so, is it possible that these intermediate states, now that we've defined them and quantify them, are actually observable in clinical samples? This is what I mean by being creative at the interface. This is a question that we cast in our lab as really data scientists because we've become very familiar with some of the controversies in the field and very, very passionate, interested in specific details about them. And so to do this project in a timely way, a postdoc joined my lab, and now she's at faculty at MD Anderson running her own lab. But at the time, she came with a cancer biology background and really hadn't done any computational work outside of like looking at cell data, and was really keen to work with computational scientists. So we decided to set up a very simple experiment, which is to take cell lines and treat them with growth factors that are known to transform those cancer cells from an epithelial to mesenchymal state. And then we withdraw the growth factor, in this particular case, TGF-beta, and watch them restore their more epithelial state again. And so we collected in the lab timecourse data. And this is just looking at a FACS analysis of lung cancer cell line under the CGF-beta study where we see the changes we expect to see under the EMT and MET driving influences. But for this analysis, we wanted to collect bigger data, more complex data set. And so instead of just doing a few markers at a time, we analyzed this data with CyTOF, and we particularly had 30 markers per cell at each time point, where we had almost 10 million cells per time point. And then it became a question of how to manage this big data, how to visualize this data, and infer biology from the data. And so we have a paper that describes how we embedded this data into a 2-dimensional space to keep true to the time course nature of the data and yet try to infer these intermediate cell states that we wanted initially to infer. And so what we're showing here is basically how we embedded the data, just a visual of the data embedding. And in doing so, that we identified 3 epithelial states, we identified 3 partial states as the cells were transitioning from the epithelial to mesenchymal, we call them PEMT states. We identified a mesenchymal state by Day 10 in this time course. Then when we withdrew the growth factor TGF-beta, we saw some really interesting phenomena where the cells were coming into a partial MET state that hadn't been identified in the EMT component of the process. And then eventually the cells restore themselves mostly into the epithelial states. So with this time course data and having identified these states, we then went on to try to infer a little bit more about them. So this is just a little bit more on the 30 markers that we analyzed per projected onto this state-space map. And you could see with each of the markers through the color coding a lot of signal, beautiful signal, and a lot of variability. And so we wanted to— so using essentially Markov modeling, we wanted to determine with this data at these time points, what are the transition probabilities? And so in our paper, you can see this method that we've developed to infer these transition probabilities employing a non-convex optimization function. And we identify where there's arrows and what the transition probabilities are. And just to highlight how do we now interpret some interesting findings from them, one particular marker that we look at and we think is really important to this EMT process is a surface marker called MUC1. And so, as we look at these states, we see interestingly MUC1, if we go from the epithelial state to the partially empty states and mesenchymal state, it seems to oscillate. But by having this model with the state transitions, we actually recognize that there is actually two different trajectories in this data.. In one trajectory, the cell starts high with MUC1, and then as they become mesenchymal, loses the MUC1. And in the other trajectory, the cells actually never express MUC1, so they move differently. So having built this model helped us recognize that this is not oscillating marker, that this marker actually doing this transition has two different states that it's looking at. There's really two different states that are showing this plasticity, or maybe cell subtypes that are showing this plasticity in this data. Then we wanted to ask ourselves, well, now that we have this cell line experiment, is it clinically relevant? We developed a mapping function using neural nets to basically map clinical samples that were analyzed with the same CyTOF panel from the primary tumor. We got the primary tumor dissociated, we sorted out the cancer cells specifically, and then every— for every single cell with our mapping function, we projected every single cell one at a time onto our EMT map. And what we found was interesting that the primary tumors pretty much occupied regions of the map that showed epithelial and partial epithelial states. And the ones that had some of the more mesenchymal features in this partial epithelial states, had more complex, we know, genomic backgrounds with KRAS and p53 mutations, compared to the tumors that were mostly driven with EGFR that showed less mesenchymal features. And so we thought this is very interesting. It's another way of looking at the same data. And we're excited about the fact that we're starting now to clinically phenotype partial EMT states in clinical samples. And we made an observation that— and this is with 5 samples— every sample that we have analyzed for the primary tumor, we haven't really been observing in the primary tumor any really mesenchymal-only or predominantly mesenchymal state. So we have made a hypothesis that maybe these tumors that have prominent predominantly have some mesenchymal— more predominant mesenchymal features are tumors that are refractory to treatment. And so more recently, we have unpublished data that shows that that is exactly the case. We've been analyzing pleural effusions from advanced-stage lung cancer patients and, and mapping these pleural effusions onto this map. And we are finding for refractory patients with refractory disease, those refractory cells are predominantly mesenchymal. And so this is very exciting to us because we're finding a different assay to describe these samples. And so in summary for this part of the talk, through work in the lab, which is this, you know, relatively small cancer systems biology lab, we identified these intermediate cell states in well-controlled cell lines. And through mapping functions, we demonstrated that they have clinical relevance, and we found a predominance of partial EMT states in primary samples and MET states within treatment-refractory metastatic samples. Okay, so now I'm going to talk about another algorithm. Called Remy. Now, and Remy specifically, it tries to look at cell-cell interactions. In the previous work, we drove the interaction because we gave the cell CGF-beta. But we want to understand, you know, what are kind of the global set of interactions in tumors. And I think this is a very exciting way to think. It's a difficult way to think, but this is a way we have to think about cancer. And we can't be thinking about one interaction. These things happen together. It's a constellation of interactions. And there is no platform right now, technology that will give us this data about what are all the interactions happening in a given tumor at a given time. But we have genomics data to try to infer what these global interactions may be. And so the questions that we ask in our lab is, can we construct cell-cell global interactome from transcriptomic data? And if so, and we have all these interactions, How do we identify which ones are important? And then how do we identify which ones are important that we can clinically validate? That's another big part of the way to think about these things. And so we have a paper where we started to generate the data to enable us to answer these questions by dissociating tumor cells, in particular lung tumors, and then profiling them. Initially, we sorted the cells after we dissociate them into bins of cell types, like the malignant cells and the fibroblasts and endothelial cells and immune cells. And then we ran RNA-seq on these cell compartments. And we've made this data available with a really nice interface if you want to look at it. And we also correlated expression levels between cell type pairs, through this interface. And so, and then we focused one of our analysis on ligands and receptors, genes that express ligands or receptors. So the receptor is on the cell surface, the ligand is its partner that there's databases of known ligand-receptor pairs. So we took the databases of known ligand-receptor pairs, and we identified which known ligand-receptor pairs are highly correlated in our data. And we created this interaction map, and it has lots of edges, 2,600 edges and almost 900 nodes. And we color code them by the cell type that that gene is expressed in, and then the shape of the nodes or whether or not it's a ligand or receptor. So this is, you know, kind of an interesting first pass at putting a network together, but it is very complex and it's not clear how to take— generate some biology from this. And we know that based on correlation alone, there's a lot of indirect edges. And so our first goal was just to try to remove the indirect edges. So we developed a tool called Remy, and it's on Bio Archives, and it was just accepted in Science Advances. To try to remove the edges. And, and so we reduce the number of edges from this correlation network of ligand receptors from 2,600 to 1,600. Still a lot of edges. And I'll just tell you very briefly about how REMI works. After we build this correlation network of ligand receptor pairs in step 1, we want to basically compute the partial correlation to remove the indirect edges. And we use tools like regularized graphical lasso to do that. But we know that when you apply it to such a big network, we're going to get reduced performance. And so what we thought of with having a background in— analytical background— that we don't have to apply it to the whole network, we can break the network down into communities, and we have communities and look at interactions between— within a community, and then look at interactions between communities. So we can apply the partial correlation analysis through— in the context of within a community and between a community to identify conditionally dependent ligand-receptor pairs to reduce the density of the network. So that's the essence, and you can look at the paper, and I'm happy to answer questions for anybody who follows up with us. But after we created this network, and we did it with the data that we generated in the lab, the sort of data that I have mentioned, we wanted to project new datasets that were being publicly available by others onto our network. And In particular, because we built a network on lung adenocarcinoma, we used some very nice data that was published by Lambrecht et al., single-cell data, and we reanalyzed it so that we can put it in the context of our model. And what we found with this single-cell data— because there are 5 different malignant cell types, 4 fibroblast cell types, 3 endothelial, and 5 immune cell types in our hands analyzing this data, that when we projected it onto our network, we had a lot of interactions, a lot of paracrine interactions and autocrine interactions. And in the autocrine interactions, you know, they're kind of pseudo-paracrine because they are interactions, let's say, within fibroblasts that are between different subtypes of fibroblasts. And so that become in particular became very, very interested— interesting to us. But then how do we actually pull an important interaction out? So what we decided to do, because we have knowledge in survival analysis, we took each cell type, and we gave it a survival score based on its ligand expression for reasons I can describe later if anybody wants to know. And so, and we found that cell types that, that, you know, in here in green are associated with good prognosis, cell types are associated with bad prognosis. And so we thought that we should use this information to tease out parts of the network that are associated with good and bad prognosis. And so we created this, you know, heat map where what we're looking at is the sending cells that are expressing ligand and receiving cells that express a receptor, and the cell types, that is, through this single-cell data that was identified, that we analyzed. And we have a heat map that is what we call a crosstalk score, how much interactions between these two different cell types. And we're annotating it also by its the prognostic significance of that cell type. And so we started then looking at crosstalk that we think was— that is associated with cell types that have good prognosis. So the sending cell type associated with good prognosis and the receiving cell type associated with good prognosis. So we kind of think, well, maybe this is more early-stage cancer. And then we looked at cell pair, like this kind of crosstalk where the sending cell is associated with good prognosis, but the receiving cell is associated with poor prognosis. And then similarly, we have poor prognosis from the sending and the receiving cells. And so this is something we could observe in our data as we were trying to kind of dissect it. And it suggests to us that maybe there is a transition like we're seeing a combination of cell— of tumor microenvironments in one that is associated with— some of it associated with good to poor, and there's transitional states as well. And we decided to focus on the transitional states, and in particular, we pulled out one particular state that is in our data, and it's a particular ligand called CTGF tumor connective tissue growth factor and receptor, LRP6, actually, and LPG. And we think it's implicated with lung cancer progression for the reasons I just said. And it's a crosstalk between— that's interesting between fibroblasts and malignant cells, where the malignant cells seem to undergo some plasticity, where they're driving up beta-catenin signaling, becoming more stem-like. This is not exactly EMT, but it's very similar in concept that the cells are changing. In terms of their cell state by the tumor microenvironment. And we focused on this because we know that there is a drug against CTGF that's in phase 3 clinical trials for idiopathic pulmonary fibrosis. And we focused on LRP6 because we know through the Human Tumor Atlas that it's mostly expressed in lung cells, alveolar cells in particular. And so we've been now wanting to validate that this— that there is indeed, for example, colocalization of these two proteins in lung cancer. We hypothesize that we shouldn't see them colocalized in low-grade disease that has good survival outcomes, and that is the case. And this is just one example of low-grade disease where we are staining for CTGF and LRP6, and we see the cancer cells are really not coexpressing CTGF and LRP6, And then sure enough, when we look in high-grade tumors, we do see co-expression of CTGF and LRP6. And again, this is in our paper, and I'm happy to talk more about the significance of this. But this is really exciting to us because we focus on this particular interaction through our analysis, and we do— are excited about its clinical relevance, specifically because of this drug. And so we have started testing lung organoids that co-express CTGF and LRP6 with this anti-CTGF drug and seeing that indeed there is— it has an effect specifically in CD44 expression that I'm showing here, reducing CD44 expression, and it seems to reduce stemness properties of the cancer cells. So we think that that's very exciting and we're pursuing that further. I'm wondering on time. I have one more. Okay, so in summary, the transcriptional data is giving us these interactions. We specifically focused on CTGF, and we think that there is some importance to that story. The last part of my work, and I'll talk very quickly, is really about now thinking about spatially resolved interactions. So we have bought an instrument, CODEX, that's developed in Gary Nolan's lab, and we have it in our lab, and we're generating data on this instrument. It's a highly multiplex in situ immunofluorescent-based imaging platform. We have used a number of markers to study fresh tissue that we have brought to the lab through our tissue bank and collaborations with surgical pathology. And now that we have this tissue and this data, and we've been generating the raw data, we know that one of the important problems is to identify the cell types in this data. And we've developed an algorithm that just was provisionally accepted at Nature Methods that we call Celesta that uses the marker expression information and spatial information to identify the cell types in minutes given a signature matrix of canonical marker expression within a given cell type. And so this is just side-by-side comparison of how Celesta works with the CODEX data. These are on the CODEX data. The color coding is specific marker expressions that are canonical to specific cell types. Type, and then the color codings are the cell types with the Celeste-based assignments. And this is just a visual, uh, um, uh, kind of assessment of the algorithm. But we want to ask the question, now that we have this highly multiplexed data, can we identify cell type pairs that are significantly differentially co-located under different conditions? Like, for example, if we compare node-positive and node-negative disease. And if we do identify cell pairs that are differentially co-localized, can we also identify significantly differentially expressed ligand-receptor interactions under the same conditions? Because that would qualify them as likely candidates associated with one condition and not another condition in terms of cross-talk in the tumor microenvironment. And so we have a study design that where we've looked specifically on head and neck cancer, and that were node— and we looked at two conditions are node positive, node negative. We looked at the primary tumors on CODEX and proximal tissue samples on single-cell RNA-seq. We did our spatial analysis to identify differential spatial patterns under the two conditions, and then on the RNA-seq data, differentially expressed genes and specific focus on ligand-receptor pairs, and then identify by putting this data together, identifying what may be specific crosstalk, spatially resolved crosstalk patterns that differentiate this node-negative and node-positive disease, and actually have done functional validation. So a metric that we have been really liking to use is something we've adopted from geospatial statistics, It's a metric that we— it's called a colocalization quotient. If cells are highly colocalized, they have a high colocalization quotient, and vice versa for low spatial colocalization. And we've— when we've compared, we've used the statistic to compare node-negative and node-positive disease in a volcano plot where we're looking at cell pairs in terms of their colocalization quotient. And even with a small data set, because, you know, it's only 4 samples. It's large for each individual dataset because we have a lot of cells. We find that even within our data, we see statistically significant colocalization patterns. In particular, node-positive disease has specific— we see that CD4 and CD8 T cells are more co-localized actually and more co-localized with each other and with malignant cells. And T regulatory cells are more co-localized with malignant cells in the primary tumor. And this is— I'm going to go through a little quickly just some data to demonstrate that within our CODEX data, we validated these co-localization patterns on an independent patient cohort that we analyzed using a tissue microarray where we specifically stain for particular markers to look at the colocalization findings we found on our 4 samples. We found that they held up in a cohort of about 80 samples. And then, and then now that we know that we can feel comfortable, we wanted to figure out what are mediators that may be driving this colocalization. We went into the single-cell RNA-seq data We look for known ligand-receptor pairings that are differentially expressed under these— between the cell pairs of interest under the different conditions. And we found, interestingly, really interesting candidates. We find that in particular with Tregs and malignant cells, there seems to be upregulation of the CXCL10-CXCR3 axis, and between the CD4 T cells and epithelial cells where there's an upregulation of CCL20-CCR6 axis. We have also worked to validate this finding, specifically CXCL10-CRCR3, with a really nice collaboration with Ed Engelmann's lab and his postdoc, Nate Ritterger-Flynn, who developed a beautiful mouse model to study lymph node metastasis identifying specifically generating cells that in a mouse model that he's harvested that are more lymphotrophic. And as the cells become lymphotropic, we see indeed that these cells express CXCL10, which we expected from our spatial analysis together with RNA-seq analysis. And we've done transwell experiments where we put malignant cells together with CL10-expressing lymphnotropic cells and showed that the T regulatory cells migrate to them more. And that's just some functional data. And then we've also done an experiment where we used an anti-CXCR3 drug to demonstrate that less T reg malignant cells actually infiltrate the tumor under these conditions. So anyway, in summary, the combination of single-cell analytics— single-cell analytics is a very, very powerful domain, especially as we're now combining genomics and multiplex imaging data— we think has the potential to reveal really interesting insights in cell-cell interactions of the tumor microenvironment associated with progression and drug response. So as a high-level summary, I just want to say I think I'm so excited to be in this space of biomedical data science, because I feel it is critical to enabling precision oncology and basic discoveries by integrating complex data through development of novel computational methods. And I really feel that as biomedical data science in particular, we have an interesting role in defining the question as more data becomes available to us and developing the expertise to develop an analytical study design. In a very creative way. And I do also very strongly believe that the promise of this science and its impact in reducing the cancer burden not only relies on the data and the methods, but the commitment to representation of diversity and ideas and approaches. So with that, I want to just cite a few folks in my lab. Benedict Ansong just developed really the tools that I mentioned about Phenostamp together with Lukia Karakasa. Alice Yu developed the REMI algorithm, and Wei Ruzhang developed the Celesta algorithm in the last set of results. And of course, all of this work and this type of science is only facilitated through collaborations because I certainly don't have the expertise to do all of it. And so I'm so grateful to really a very collaborative community at Stanford and a number of collaborators, including Gary Nolan and Ed Engelmann in particular, and Andrew Gentles, Ann Liang, Johnson Wu, and Christina Kong, to name a few. And of course, to our funding sources through the NIH CZI, the FIND, and the Emerson Collective Foundation. So thank you so much for your attention. I really, really appreciate the opportunity to share this talk with you today. And I'll stop sharing.
Thank you very much, Sylvia, for this wonderful talk. Before I allow others to ask questions, I'm going to ask you a burning question. This type of very interesting research that you are doing, and you mentioned the important role of biomedical data scientists in defining questions like the ones you have presented. Of course, that requires very deep knowledge of the biological questions that are pertinent and the cutting-edge biology that may be relevant for problems such as the ones you mentioned. Do you have any advice for our community to— and for the center in particular, and in general for everyone who tries to build this type of research agenda like you did? What can we do, and what can the younger scientists in our community do to make this journey, to be able to understand enough of both worlds to, to answer, to ask and answer the right questions?
Right. I think it's building that interdisciplinary community. And so when we started building it at Stanford, we actually got a training grant from the NIH and, and the design of the training was not only training our, you know, the trainees, but also the faculty. And so, so we had faculty mentors that work together to take, for example, a cancer biologist who will remain a cancer biologist, but came into this postdoc training to learn to use computational methods, and so we weren't asking them to develop a new computational method, but we were asking them to generate data that would be used in a novel computational method and help us interpret the results of that finding in such a way that we can functionally validate those interpretations, so the cancer biologists absolutely had a super critical role to wanting to learn the language of computational science. And, and, and they then are like, they have left our program and moved into faculty positions where they seek collaborations with computational scientists, because they recognize the power of computational science in answering the question that they're most excited about. So it was developing them in that way. And then on the other side, we brought in at the same time, in the same cohort, computational scientists with grant backgrounds in electrical engineering, computer science, who, you know, knew nothing about cancer biology but really wanted to make a difference. In cancer biology or in a biomedical domain. They were very excited about the domain, and so they wanted to understand the domain, and so we had them take courses and work with our cancer biologists and really sort of force them to kind of ask them questions about, like, why do you want to answer this question? Why is it important? Why? And so— and it needed— when their answers needed to make sense to us, to the cancer biologists, to the cancer biology faculty, And so then they then worked very closely with their paired cancer biologist scientists to make sure all along the way they were doing things that were relevant. So it really is, you know, the team itself has to care about the same question and come to it together from both sides. And that's what I found was really important. And then as the individuals involved, They built the language to be able to have the conversation with other scientists, and so they recognize the importance of continuing that culture. And so then when you do that, that kind of community grows.
Thank you very much, Sylvia. Are there any questions from the audience? Please, if you do, either post them in the chat or, or just unmute yourself.
And, uh, hi, Professor Pleberidis. Hi, Professor, um, VanderChar.
I keep forgetting.
Um, so I have worked in, uh, cloud security applications, Professor Pleberidis, where, uh, for healthcare systems. Systems and NIH being the regulatory and kind of overarching organization in the US. Have you had any problems with obtaining the real-time or at least current data as far as lab-based data is concerned for your research to develop these models?
So any data that we get that we analyze, any tissue that we analyze in our lab, has to have something called institutional review board, has to have the IRB sign off. So we can't get any tissue in the lab without a governing body knowing exactly what we want to do with that tissue. And, and so our analysis has to be pre-approved. And, and so, so now, we also don't need much data. Well, we don't need any data for anything that we've done to date that requires us to— that's patient identifying. And so with the data that we have is fully de-identified data, and, and nobody in our lab holds the key to identify the data. And so there are certain rules and guidelines that we have to preserve in order to use patient data so that we protect the issues— to have this issue of privacy and security. Also, we work in very secure environments that we can only keep our data in very secure— on very secure platforms. And, and we have to undergo training every 2 years. I just finished my, you know, training again, about just, you know, remember what all the rules are, what identifying information is. For example, the date somebody had surgery is identifying information, you should not have access to that date. If you have access to that date, it is your responsibility to report that and say that you have identifying data. And so I say, you know, we work in an environment that's regulated for good reasons, and there's a lot of oversight with respect to those issues. And so my lab in particular doesn't need identifying data. Like, we just don't, not for anything we do. And if We want to get some other piece of information that's, you know, about the tumor that's not PHI or it's kind of data, protected health information, PHI. We go back to the clinician who has the key and says, hey, can you give us this additional data stream? And then, and they key it, they send it back to us under the right key. So we're able to work very comfortably in that environment with protecting patient privacy.
Okay, great. Thank you, Sylvia. Since there is no other question, I would like to ask you one more question from the— for the early part of your talk, when you have the state-based model. How many states— how do you decide how many states to have? That's the first question. And what is enough? And how do you know that these states are real? Is the domain knowledge or do you do state identification on the basis of the data to determine the real number of states that they are transiting through? And another thing in general, when you talk about such complex systems, how do you deal with these issues of identifiability to make sure that indeed what your model does is indeed what corresponds to what you see, especially since you don't observe when you observe maybe always everything, or you observe aggregates, or you observe such huge amounts of cells?
Yeah, so with respect to the first question, when we identified the states, we took into account that we wanted to see what was most expressed at the specific time points of interest. So we knew that there was an emergent cell types within the time point. So we considered that that's something we had to capture within our analysis. And then with that framework, we looked at— we identified within a given set of markers, when we identified the states, we specifically used canonical markers that we were— we know that were associated with EMT because because if we had used all the markers, we would identify a lot of states. So we used 6 canonical markers associated with the MT within our time course, and then we had a reasonable number of states with those 6 markers through unsupervised methods. And so— and we describe the process in more detail in the paper, and I'm happy to talk with you more about it. In terms of identifiability, that's so important. Any time you develop a new algorithm, you have to answer the question, how do I know this is making any sense? And how do I know it's not overfitting data and things like this? And then also, how does it compare to other methods? You can't publish anything unless you answer those questions. And so for example— and the answer to that also requires domain knowledge. And so, and it's different, and it's like, it's really boutique for every single thing you do. Everything we do in this work is boutique. And so, so with respect to like, I'll just give you one example. When we developed the global interactome, we don't have any global interactome. How can we validate that our global interactome makes any sense. And so what we did is we said, OK— and we don't have a lot of data, sorted data or single-cell data also. And so we took the TCGA, which is a lot of data, and we created— we took ligand-receptor pairs. In lung cancer, I think there were like 900 canonical known ligand receptors that were expressed in TCGA that we know we that are likely pairs, that could— candidate pairs. And we have like thousands of samples in TCGA. So we created a network with thousands of samples on these 900, you know, the possibilities inside 900 ligand-receptor pairs. And we applied to, you know, it's a little bit more identifiable because we applied like graphical lasso to that large dataset, and that became our gold standard. Then we subsampled that data down to 15 samples. You know, which is like our data. And we said, how close can we get to something that we were able to reconstruct from thousands of samples? And so even though the one from thousand samples may not be physiologically relevant as a construct, it is, you know, it is a data-driven construct that has, you know, a validity. And so we tested, you know, subsampling effects on that. So that was one way of doing it. But then to your other question, sort of more broadly, when we were trying to figure out, well, how do we identify what part of this network is important? There was no inference really. We just— we labeled— we gave things some kind of progression score without any kind of uncertainty because we don't have it. Or maybe there's a way to quantify it. I'm not exactly sure how. Maybe there is a way, but we didn't. But at that point, we were only looking at maybe 20 candidates, pairs. And so we're not going to say it's true. We're just going to say, okay, we have, you know, through all these filters, we come up with these 20 pairs. We need to pick one to take and functionally validate. So we have to functionally validate. So even when you're uncertain and you don't have all the statistics you want, you still have to functionally validate. Whether or not you have the statistics or you don't have the statistics, you have to functionally validate. So we didn't have all the statistics, but we, we had created so many filters that, you know, for something to come through all these filters, we thought that that was a high bar. And so we came down to the 20. And then when we saw, like, when we picked, we picked based on, well, you know, there are drugs against some of these, why don't we pick the ones that we can functionally validate? And that are really interesting. And so we decided to go after this one that is associated with lung fibrosis, and we think that that has some relevance to cancer, lung cancer. And that's kind of the thinking. So sometimes it's not satisfying to, like, an analytical person who wants to have very rigorous methods before sort of taking things forward. But you have to remember, you do need to make decisions, and that's not the final answer. It's never going to be the analysis. It's going to be—
No, like you say, it may never be the possibility to understand every single bit of such a complex disease with so many things interacting. So I guess very useful food for thought for us. Yeah. I'm sorry, I think somebody else was planning to ask another question. Somebody was saying— Is there another question? If not, um, well, if not, thank you very much, Sylvia.
Thank you so much for having me.
Thank you so much, um, all the insights you gave us, and we look forward to welcome you in Cambridge hopefully sometime.
That'd be great. Okay, terrific. Thank you so much.
Thank you very much. Thank you for the talk.
Goodbye.
More from Joshua







Scientist Stories: Hans Waterham, The value of phenotypic assays in peroxisomal disorders




Scientist Stories: Joel Zlotogora, Genetic carrier screening programs for reproductive purposes