Scientist Stories: Uri Alon & Herbert Sauro, Systems Biology of Protein Signaling
This recorded seminar, part of a monthly series on modeling biological processes, featured two talks followed by a discussion. Herbert Sauro (University of Washington) presented a control‑theoretic view of protein‑signaling phosphorylation cycles. He introduced elasticities (kinetic orders) from biochemical systems theory and metabolic control analysis, showed how ultrasensitivity arises when enzymes become saturated, and explained how cascades amplify signals via the product of individual elasticities. Negative feedback around the MAPK cascade was cast as a classic feedback amplifier, with loop gain (A·K) determining signal‑tracking behavior. He highlighted sequestration effects that create additional conservation laws, leading to bistability, minimal oscillators, and ring oscillators, and discussed the challenges of building predictive mechanistic models versus large rule‑based models. Uri Alon (Weizmann Institute) shifted focus to hormone dynamics. He described the classic fast‑time‑scale hormone feedback loops (CRH‑ACTH‑cortisol) and argued that slow variables—functional masses of the pituitary and adrenal glands—must be added to capture month‑to‑year phenomena. The coupled growth‑feedback circuit yields integral feedback, robust steady‑states, and a natural ~1‑year oscillation that can explain seasonal hormone patterns, gland size changes, and clinical observations such as delayed cortisol peaks, latitude effects, and drug‑tapering hysteresis. Alon showed how massive health‑insurance and imaging datasets can test these predictions, and suggested translational applications like hormone‑axis controllers. The discussion addressed data heterogeneity, the value of minimal versus Frankenstein models, and the path from mathematical formulas to clinical tools.
Chapters
series in the past. The way that this particular seminar series is structured is that each month we're going to focus on a particular biological process, maybe protein signaling today or metabolism, and as we scale up things like whole cell modeling. And the idea is that each specific biological process has its own unique challenges and unique solutions. That one, will be interesting to discuss in isolation, and two, many of these solutions can hopefully be used in other biological processes. Hopefully it's a good way for us to share solutions to common modeling problems. So we have 8 seminars in total. Today's protein signaling, and then we'll be doing gene expression, cardiac tissue, whole cell modeling, cancer, microbiome, neurological systems, and metabolism. The way that each seminar is structured is that there'll be two 20-minute presentations from leaders in that particular biological process and how it's modeled. And then that'll be followed by a 20-minute group discussion. One of the goals of having two presentations is, well, in addition to hearing two interesting approaches, hopefully it'll motivate a more general methodological discussion afterwards. So, the goals of this series are— of the group discussion are to identify common challenges, for individual people to share personal solutions, like not just the presenters, everyone is encouraged to participate. 3, we can brainstorm new solutions. And, you know, 4, hopefully we'll end up creating a collaborative community of modelers. This will be one way we can all come together and do that. So, the rules of the discussion are: 1, err on the side of commenting. If there's something you think might be relevant, just go ahead and say it, it probably is. Two, honest debate is encouraged, just be polite. And the most important rule, of course, is mute your microphone when you're not talking. Today we're gonna be hearing about protein signaling. I don't think Dr. Alon is here yet, but hopefully he'll arrive. So to start, we're gonna have Dr. Sahra, University of Washington. So, Dr. Sahra.
Let me just stop sharing. All right. Okay. Thanks, Sarah. Yeah. Ready to go. Yeah. Okay. Share. There it is. Okay. All right, let me just make it full screen. Assume everybody can hear me. Actually, is it showing on the wrong screen? What are you seeing at the moment?
It's showing the presenter mode right now.
What I see, not what you see?
It's showing what you see. Okay, how do I get it to You should be able to select specifically the presentation when you do this screen share. And that should just—
I try again. Slideshow. I've seen it do— what's this like?
I believe that's what you want.
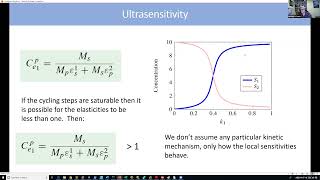
It's just this slide. Okay, good. Okay, well, thanks for your introduction, Joseph. And thanks for inviting me here today. So I've been sort of thinking about signaling for quite a long time, on and off over the years. And I'm now back in it a lot of my time. We just got an award last year to start working again on signaling networks. So we've got two projects. One is to understand the properties of signaling networks from a control theoretical point of view. And the other one, which is perhaps more relevant to a lot of people, is how can we actually build predictive mechanistic models of signaling networks? And signaling networks are particularly difficult. It's difficult to make the measurements. There's a lot of uncertainty in what we know about the signaling pathways. And I think it's been very hard for people to build predictive models that one could trust of mechanistic models. Now, I was hoping I was going to talk about this in this seminar, but we don't have enough data yet that's ready for consumption. So we're working on a number of different approaches. So my take is that we need to revisit how we model these things. Maybe in a year's time I can come back and let you know how we got on. We're working with Steve Wiley at PNNL, Tim Ellison at Chapel Hill in North Carolina. They have access to a lot of data and will be able to produce a lot of data, a lot of different kinds. And so we're rethinking the whole way that we should perhaps approach modeling. So today I'm just going to talk about some of the properties of signaling networks, some of the work I've done over the last 20, 30 years, and also cover some of the work from my colleagues as well. So I guess if you open a textbook, you'll see— an undergraduate textbook— you'll see a picture like this of a signaling pathway. It's a classic view where we have a receptor at the top. Does my pointer work? Receptor at the top, and then we have a series of phosphorylation stages that results in a final output that then often changes gene expression, resulting in a change in cellular response. Now this is a very— This is a very simple view. This was the view perhaps in the 1980s, but since then, of course, things have become a lot more complicated. You now have multiple receptors of different kinds with parallel cascades that are talking to each other. And for what reason, nobody entirely knows why, but presumably to modify responses. And there's an awful lot more regulation, especially feedback control at multiple levels within the pathway itself. There's a lot more complexity than was envisaged originally. And just trying to unders— I mean, it's one thing to model it, but there's another to try to rationalize what this thing is actually, quote, computing. So I'm going to talk about some aspects of that in this short talk. So the elemental unit, I suppose, of a protein signaling network is the phosphorylation cycle. So we have an unphosphorylated protein on the left. It gets phosphorylated by a kinase. On the right, and that can be the output either for another stage or as the final output to change gene expression. So before we can start, of course, we need to understand the properties of this little unit, and this is pretty well under— to some degree well understood ever since the late '70s and early '80s. So I'm going to talk about, just briefly go over a theoretical approach that can be used to understand these kinds of networks. So this control theoretical approach, it's an attempt to understand the behavior of the system in terms of its parts. It's something I've always been interested in. I found right at the beginning of my career that when I did simulations, it didn't really tell me how the thing worked. The computer sort of kept the secret inside itself. And so I was— I therefore switched to theory, and that was a way of trying to understand the results that poured out of computer simulations. Now, the general problem of understanding the behavior of a system in terms of the parts is insoluble because the system is nonlinear. But you can get a long way by linearizing the system and looking at small signal responses. And in the past, there's two published frameworks for this. BST, the biochemical systems theory, which came from Michael Savageau in Michigan. He's now in Davis, I think. And metabolic control analysis, which came from Europe from Heinrich in Berlin and Katcher in Edinburgh. And I sort of grew up on MCA, so I know quite a bit about it. Now both approaches— there's been some tension between the two, but both approaches are actually the same. The differences exist in notation, and some of the emphases are slightly different. Like biochemical system theory focuses more on stability, for example, and metabolic control whereas control analysis focuses more on theorems and propagation of signals. OK, so one of the most fundamental parts of this approach is something called the elasticity. I've got a table here on the right that compares the symbols that are used in MCH to the symbols to BST. And the ones that are of particular interest are the bottom 3 rows, the elasticity. So in biochemical systems theory, The elasticities are called the kinetic orders. You'll see the symbols h and g used frequently in BSD. h is used for generally for the products, and g is used for the reactants. In MCA, the elasticities are usually indicated with an epsilon, with a subscript and superscript. Now, the elasticity is a simple thing. It just measures the responsiveness of a chemical reaction to changes in substrate and other effectors. So if you were to plot— if you took an enzyme, or a kinase, or a phosphatase, and plotted the rate of the reaction versus the concentration of substrate, you might get a curve like this, a hyperbolic curve. The elasticity is simply the scale slope at a particular operating point. So it tells you how sensitive the reaction rate is to changes in whatever substance, product, or effector you're looking at. And in the top of the slide, an easy way to think of it is that the elasticity is roughly equal to the percentage change in rate divided by the percentage change in effector. OK? Now these are important. The elasticities are important because they are the connections between all the steps in the network, and they show how signals jump from one step to another. The amount they jump is dictated by the strength of the size of the elasticity. So if you remember in the first slide, In this, I have just a 4-step pathway here. So if I were to make a perturbation in the first step, that perturbation will propagate downstream, changing S1, S2, and S3. And it's the elasticities that transmit that propagation. If I were to make the perturbation in V2, the second row, the propagation goes upstream and downstream, and so on. V3 goes upstream and downstream. V4, it can only go upstream. Now it turns out that the response of the system to this perturbation is proportional to the product of the elasticities. Okay, so it's proportional to the product of elasticities. And you can think of the system response as a ratio of the propagation path that the perturbation takes normalized by the by all propagation paths. Okay, so that basically gives you the system's response. There's a lot of literature that tells you how to compute these system responses. Michael Savagey's book from '76, I think, is an absolute mine of useful information. The notation is perhaps different from MCA, but the work in there is actually really great. Janni Hofmeyer wrote a very a very dense summary of how to do it, and that's fairly theoretical, which may be too much. But I just published a book for the general reader, which goes through all this material. So if we go back to the signal phosphorylation cycle, work was done in the '70s and '80s. Probably the most well-known one, you know, is the Goldbetter and Karshland paper, but work was done on this beforehand. And they discovered that— These cycles have particular properties, which they refer to as ultrasensitivity. So let me just show you, let me go flick on a couple of slides here. So ultrasensitivity, so if you look on the right-hand side, is where if I plot the output concentration versus the activation of the forward loop on the cycle, I get this sigmoid response. Okay, so that's— so these cycles can be very sensitive to changes in the input, and that was considered one of their key properties. Now, in the original Koch and Golbeter paper, they did this analytically using a particular— they invoked a particular kinetic mechanism, Michaelis-Menten and so on, and they went through quite a bit of algebra to show that this was the case. But you can do it much simpler if you use this small signal approach. I won't go through the proof, but essentially what you get is an expression such as this. So the system response CPE1 is the ratio of the mole fraction of species S divided by this denominator. Now what's interesting about this denominator is that both elasticities, the forward one and the phosphatase one, are summed. Now if both reactions are working in the linear range, the elasticities tend to 1, and when they tend to 1, of course, we get this simplified version, and this is always less than 1. So the sensitivity of a single cycle when both enzymes are running in the linear range is less than 1, and therefore you don't see any ultrasensitivity, and you just get this hyperbolic response. Now the minute the steps start to become even a little bit saturated, these elasticities drop below 1. And the minute they drop below 1, of course, the denominator becomes smaller than the numerator, and the sensitivity starts to shoot. Starts to shoot up. In fact, it increases quite rapidly. So this is the response of the network versus the values of the two elasticities, assuming they're the same value. And 1 is really the cutoff point where it behaves either as a hyperbolic response on the right or behaves as a sigmoid response on the left. And the sensitivity rises extremely rapidly as the elasticities fall. So what's nice about this approach is that it doesn't assume a particular mechanism. If I just go on to the same slide. So what's nice about this approach, it doesn't assume any particular kinetic mechanism, only how the local sensitivities behave. So it's much more general in that sense. So it's, in a sense, lifting you up above the details of the enzyme kinetics and looking at a higher-level behavior assuming that the underlying mechanisms behave in certain ways. OK, now you can extend this to lots of layers of cycles. And it shouldn't come as a surprise to you that perhaps that the overall sensitivity across the entire stack is the product of all the individual sensitivities. And this was worked out by my colleague Boris Kolodenko some years ago. He showed that, let's say, if you have 2 cycles, The overall response of the output P2 to the signal S is the product of the two individual responses. Now, this is making the assumption that there is what's called no retroactivity from the second cycle back to the first cycle. In other words, that P1 is a kinase which actually has to bind to the protein S2, and in that when it does that, it can affect the properties of the upper cycle. But we assume that's negligible. If you assume that, you basically just get a product of responses. In fact, for a pathway, a cascade of arbitrary length, it's just a product of all the individual ones. Now, if the individual responses are, let's say, high— let's say you've got a response of 4 on each layer, then the overall response for this one is 16. So you can think of these responses equivalent to the Hill coefficient. And so you can get really high responses from signaling cascades. So there's no doubt that these things can be very, very responsive if need be. Okay, so now we don't find these cascades like this. Often we'll see a negative feedback loop. And the pathway we're working on, which is the ERK pathway, in cancer cell lines, the cascade from RAF down to ERK has a negative feedback loop running from ERK back to RAF. And it's an odd thing. When I first came across this, I thought this is a rather odd thing for nature to do because I wasn't an engineer at that time. I didn't understand what evolution had done. I thought it was a rather odd thing to do. You have this great sensitivity that you've acquired through the signaling cascades, and then you slap a negative feedback around it, which basically dulls sensitivity, and I thought that doesn't make any sense whatsoever. And I was talking to some engineers, control engineers, many, many years ago, Mustafa Kamas in particular, and he explained to me the virtues of negative feedback in terms of electronics, and it dawned on me this is exactly perhaps what was happening in the MAPK kinase. Now you can derive the response with negative feedback, And instead of getting a simple product, you get a ratio. And I'll come back to this in a minute. And this is actually quite an interesting expression. Now, if you go to the control literature, the classical control theory literature, you'll see diagrams like this. And when you look at them first, you think, I can't see any relationship between these diagrams and— biology. And I thought the same for a long time, and I couldn't figure out what the connection was. But what you— and I'm going to show you that now, actually. So for this system here, we have an input, which is generally what's called the set point. It's compared with the output through this comparator, which generates an error. And then the error feeds into an amplifier, which generates the output.. And then part of the output is returned as a feedback. So that's our generic negative feedback diagram. And if you run through these boxes so that the output of every box is the product of the box times the input and solve the equation for the output in terms of the input, you get this simple equation here. And this is probably the most important and probably famous equation in control theory, classical control theory. It describes how— how the system behaves in the presence of feedback. The terms here are given particular names. A— so A is the amplification gain. So this is equivalent to the cascade of signaling phosphorylation cycles. K is the degree of feedback. And so AK is the most important term here. It's called a loop gain. And in engineering, you want the loop gain to be as high as you can go without unfortunately causing instability. But now I won't touch on that. But anyway, you want a decent Ak, and when that happens, if you imagine increasing Ak, as you increase Ak, the 1 that's added on becomes less and less important, and you can cancel the As out and you end up with the output equals the input divided by K. So in effect, the amplifier has disappeared, and you now have a linear relationship between the input and the output that's just proportional to the degree of feedback. And this is probably the most important thing in all of control theory, and it's used everywhere to improve the performance of amplifiers. Now, if you look at this equation here, this is also derived by Boris Kolmogorov. If you look at this equation here, you can see that it actually looks like the equation that the control engineers produced. In fact, it is actually the same one. So in the denominator, there's a product term here, R21, R12. This is the feedback term that corresponds to Ak. There's a negative here and a positive here, but that's OK because it actually is overall positive because R21, which is the effect of P2 onto— the first step is actually negative in value, so two negatives make a positive. So the thing is exactly the same. The R21, which is 1— so S on the effect of P2 is the overall amplification of the stack— is equivalent to A. So this equation here is actually almost identical— well, it is identical to the equation of the control engineers produce. So here I've just shown you— I've just labeled them. So R2K is A. The set point— now we can identify the set point. So the set point is actually the signal coming in. And then R21, R12 is AK. So if the loop gain is high, which we expect from a cascade of phosphorylation cycles— as I said, you can get really enormous ones— this equation reduces to this value. And so long as the— feedback term is relatively constant— and that's a debatable point because nobody actually knows whether that's the case in a cyclic network, although in electronics you can guarantee— always guarantee it— this basically is the equation for a classic feedback amplifier. So in other words, a signal tracker. OK? So if the theory bears out, it basically suggests that this kind of structure behaves as a signal tracker. So if S changes by, say, 2%, P2 will also change by 2%. So P2 basically follows the signal, which is what you want in a feedback amplifier. Now you can do simulations, of course. And I published this work quite a long time ago in the— as they call them, the noughties, I think 2004, 2007. The 2007 paper was as a preprint. We couldn't get it published because the reviewers didn't believe us, and they didn't think it was is important anyway. But if you run the simulations, you will get— so the blue lines here are without feedback. We progressively increase the strength of the feedback, and the line becomes more and more linear. So in simulations and in theory, it seems to suggest that this arrangement of feedback and cycles acts as a negative feedback amplifier. Since then, a number of groups have done— looked at this experimentally. There was a recent one just a year— over a year ago in eLife by Nunn, by Nunn, Zahn, Gonet-Toro, if I pronounced that right. And there was an earlier one in 2010 by some colleagues in the UK. They basically showed that these signal pathways act as linear transmitters. Parameters. So that was a nice confirmation anyway of the theory and the simulations. Now, without the theory, it would have been difficult to understand where this came from. But this is why I like theory, because it helps you interrogate the simulations that you do and helps you try to understand the behaviors you see. OK, you can do exactly the same thing with metabolic pathways. You get the same results. So they act in the same way as well, although the purpose is is probably different. It's not for transmitting signals. It's more likely for maintaining the final product constant in the face of varying demand from the output. So you can find a lot of this in my 2017 paper on— well, Society Interface. OK, now, so that's very nice. That's very clean. It seems to experimentally show probably the case. Theory works very nicely. Unfortunately, there's, uh, there's some problems, there are some complications, uh, which is one reason why I sort of stepped back from signaling pathways because of this paper here by, uh, Markovitch, Hoke, and Kolmendenko. It was published in 2004. It was a bit of a shocker for me, and I thought, oh, we'll never understand signaling networks if this is the case. So let me explain what they did. So we normally model these systems— in the past, at least— we model these systems by invoking Michaelis-Menten kinetics on the forward limbs and Michaelis-Menten kinetics on the reverse limbs. So this is a double phosphorylation cycle. S1 is unphosphorylated, S2 has a single phosphorylation site, and S3 has two phosphorylation sites. Now, you can model it with 4 Michaelis-Menten equations, but this group decided to blow up each step and model each one as an explicit set of mass action reactions. So here they modeled the binding of S12 free enzyme to form complex, and they did this for each one, OK? And you might be thinking, you know, well, what, you know, what could possibly happen here. Well, the first thing that happens is there are now 3 conservation laws. By the way, one thing I should add here, in these cycles, there are conservation laws, or the conservation of mass. So in this case, S1 plus S2 plus S3 is a constant because there's no new S2 coming— there's no new S coming in, there's no new S leaving. So the total mass of the system is constant. There's only one conservation law here. The minute you blow it up, you get another two. You get— first of all, you get the S moiety is part of the free S moieties on the complexes, so ES1, ES2, ES3, and ES4. The enzymes themselves, the kinase is part of a conservation sum, and the phosphatase is part of a conservation sum. So that's the first thing that happens. And this actually leads to some dramatic change in dynamic behavior, as they showed. So let me just go through this thought process. So here we have the signal S. So let's increase the amount of signal. This will increase the amount of the rate of V1 and V2, OK, by the signal. When V1 and V2 increase, this will increase S2, and it will also increase S3. Now, more S3 will bind to E2 to form ES3, and the rise in ES3 will cause a decline in ES4 because of the conservation laws. And of course, if there's a decline in ES4, there will be a decline in E2, and V4 gets repressed. So effectively, S3 acts as an inhibitor, a sort of indirect inhibitor of V4. Now, there's also a mirror regulation on the upper limb. So I can redraw this complicated network to look like this. So we have these implied regulation loops here. S3 represses V2, and S1 represses V3, all because of the extraconservation Now, those of you who know a bit about bistability will probably recognize this as a toggle switch. So if I were to collapse that network down to simplify it and remove the S2, you'd probably immediately spot this as a toggle switch. And in fact, if you do the simulations, this is a bifurcation diagram, this thing turns into a toggle switch, all because of the— excuse me— all because of the conservation —was. And so what I saw— yeah?
Oh, um, could you like wrap it up in a minute or so?
Yes, I'll wrap it up now. This is the last scary bit I want to talk about. So you'll end up with bistability. And this is a very scary idea that just from innocent changes like this would result in completely new behavior. We went on to show that you can combine this with other things. You can generate oscillators. Of reduced size. Normally oscillators take 2 to 3 steps. We could do with just 2 layers. And also you could create unique ring oscillators with using this effect as well. So the point here is that sequestration— this is basically a sequestration effect— adds new behavior. And it's largely uncharted territory, and nobody quite knows the extent of this. So these are the— this is my last slide. So the open questions and comments. So there may be much more dynamic behavior in signaling networks given the subtle effects of sequestration. On the other hand, feedback tends to linearize responses, so maybe not. There's a lot of crosstalk between parallel signaling networks, and we don't exactly know what they're up to. The thing that we're trying to do at the moment is how to build predictive models. And the one thing I haven't mentioned at all are rule-based models, and I'm still on the fence on these. And these are basically where you devise a set of rules that then get expanded into much larger networks. And I'm talking about thousands of reactions in these networks. And at the moment, I'm not convinced that they improve the models. And also, there's currently no theoretical means to analyze such large models. So I think for the rule-based models, we first, we need to show that they genuinely are an improvement over the classical ones that have been done in the past? And secondly, how on earth do we analyze such large models? And so that's it. So that's just my acknowledgments for the work. OK, thanks very much. Sorry that took a little bit longer than I expected.
Thank you so much, Dr. Sara, for presenting. OK. Could you exit the screen share? Oh yeah. Okay, so everyone will hold off on questions just for a second until we hear our next presenter. I would like to present Dr. Uri Alon. He's a professor at the Weizmann Institute of Science. Dr. Alon? Oh, hello.
Good evening. Hi.
Hello.
Hello. Thank you so much for coming. I can give you, I guess, a quick intro. So one of the goals of this online seminar Is we're various people who work on modeling different cell processes. So this is one effort to bring us together and share our own solutions on modeling challenges. And this seminar series is focusing on one biological process at a time. And analyzing it in isolation, see how it's modeled, what the challenges are, and hopefully brainstorming and extrapolating that to other processes.
I really enjoyed Herbert's talk. It was so well elegant and— I actually prepared something that's about mathematical modeling of— it's not on the proteins in the cell, it's about things we're working on now, hormone dynamic pathways.
What do you think? I think it's relevant. Like, well, hormone pathways in animals probably does have similar challenges. But one of the main goals is just to see how modeling is approached in general. So we'd all be very excited to hear it. Great.
So how modeling works, yeah. So do you see this screen? Not yet. Let's see if we can get it. And screen. Is this— is it shared? Yep. You see Principles of Hormone Dynamics? Yep, we got it. So, um, yeah, so, you know, for years I was working on, on stuff like Herbert described, on gene regulatory circuits and their principles and engineering principles, and recently got interested in can we apply some of these principles to physiology? So if you look at the body, the dynamical variables here will be hormone concentrations and the number of cells that secrete them. But a lot of the thinking is similar. And so I wanted to talk— tell you about an amazing thing that happens in our body, is that the major facts of life in vertebrates are controlled by hormones that all go through the same pathway and through the pituitary gland. And talking about control of response to stress, metabolism, sex, and growth all go through the same kind of dynamical system where you have signals in the brain that secrete— that cause secretion of hormones into the pituitary, which is a gland that has many kinds of cells that secrete hormones into the bloodstream. For example, stress secretes a hormone that goes to the adrenal gland, it makes cortisol. That's our main stress hormone that affects our behavior and metabolism and allows us to adapt to stress. And, and let's say cold temperature and stuff like that may cause secretion of TSH that makes our thyroid secrete thyroid hormone, hormone that makes us become warm and affects the whole metabolic rate of our body. And sex hormones, LH and FSH, go to the sex organs to make testosterone and estrogen. And the same gland also has prolactin and growth hormone that makes us grow, IGF-1. And then, just like Herbert said, there's— after this beautiful amplifier, because you have negative feedback, Just like in Herbert's talk, going back where the hormones like cortisol shuts down the two hormones above it, and so does thyroid hormone, so does testosterone. So there's this negative feedback, and it's a double negative feedback, both on the pituitary and on the brain, the hypothalamus. So that's, uh, that caught my attention. It's an interesting system to work on. Am I being clear so far? I don't know. Yes. And when you look at this system, you can think about the time scales. Is it— Joseph, is it clear? Can you see everything?
Yes, we can.
Yeah, it's very clear. Great. Okay, so I'm going to talk about time scales a little bit here, because when you look at the half-lives of these hormones, they're all on the scale of hours, minutes to hours. So cortisol has a half-life of 90 minutes, and some hormones have half-life of minutes. And you can explain with that things that happen when you have acute stress and you get, you get this cortisol rush, and after 90 minutes is gone. So that's a rapid time scale, it's hours. But there are a lot of things in medicine where you have problems that last months that are related to these hormones. There is, for example, mood disorders are related to dysregulation of these hormones. And you can take drugs like glucocorticoids to suppress your immune system, and they are basically like cortisol. But then if you take it for a few weeks, you have to taper them down, otherwise you have big problems and seasonality effects like that. So it's not clear right now in medicine how to bridge between the minutes and hours lifetime of the hormones and the hours, then the weeks to months timescale of clinical phenomena. So that was interesting for us. How can you explain months with this timescales of hours? And then indeed, the classical models of these axes and the textbook models can be just turned into differential equations similar to what Herbert describe that give you a phenomenon on the scale of hours. So for example, you model like this. So how much CRH— the reproduction of CRH is the input. And because cortisol inhibits the production of CRH, you have 1 over cortisol here. It should be some kind of Michaelis-Menten, maybe 1 plus cortisol over K. And then CRH has its lifetime, so it gets degraded. And ACTH is produced by CRH and suppressed by cortisol has its lifetime. So these kind of equations, you can simulate the feedback loops, and you can explain things like variation over the day. You have peaks in the morning when you wake up in cortisol, and then slow at night, and all kind of phenomena on the scale of hours. But you can't explain phenomena on the scale of months, like this recovery from glucocorticoids. It takes months and overshoots. So here we went to the literature. So here's theory, right? So we're theorists, and one of the great things you can do in physiology is read the hundreds of studies people have done over the decades and, and try to find evidence for specific theoretical questions you're looking for. For example, what can take weeks and months? And when you think about weeks and months, there's two kinds of things in the body that can do that. One is epigenetic changes, methylation, that I'm not going to discuss. And the other one is the scale of growth of tissues. You know, tissues in our body constantly turn over. All the cells in our body replace every few months or years in most tissues, except for brain and heart. And here, for example, this is the adrenal gland. It secretes cortisol. And when animals are stressed and also people are stressed, the gland just grows. It grows. Not only you have more stress hormone, the whole gland grows by a large factor, 2, 3. You can see that in autopsies of suicide victims, etc. Large adrenals. That's actually how this whole system was discovered, these large adrenals, before anyone knew about hormones. So we thought, okay, here are slow variables we can add. Just the mass, the functional mass, the total mass of the cells that secrete the hormones.— then they'll have time scale of weeks. So to this classical cascade of the three hormones in the feedback loop, we add the fact— this is very interesting— that the glands can grow. So this is cell turnover, and the interesting thing is that the growth factor for these cells are none other than the hormones. So the pituitary cells that secrete ACTH, their growth factor is the CRH. The CRH not only makes them secrete the hormone, also makes the cells divide. ACTH not only makes adrenal cells secrete cortisol, it also makes them divide. So now we have slow timescale effects coupled with this fast timescale feedback. And to our previous equations, we can add these P and A variables, which are the functional mass of the pituitary and adrenal glands, and then equations for the cells. And equations for cells have a very interesting feature that's different from most proteins, because all cells come from cells. So you have production is number of cells times something, and removal is number of cells times something. You can take the number of cells out of the parentheses, and that's very— that actually creates a problem because all cells come from cells. So if division rate isn't equal to death rate, if division is larger than death rate, you have an exponential growth of the cell, like tumor. Or if death rate is larger than division rate, you have degeneration, shrinkage. So a circuit, when you think about it in the body, every organ needs a circuit. It just keeps proliferation equal to death. Otherwise you'll have a big problem. And in fact, this circuit that I'm showing you here with the— does that. It can keep a steady state size of these tissues and also do a lot of amazing other things. So why is that? Because proliferation of pituitary cells is regulated by the CRH, and the division of adrenal cells is regulated by this ACTH, which are themselves in a feedback loop that has this PNA. So this creates what's called integral feedback. Steady state is reached when CRH is equal AP divided by BP, and when ACTH is equal AA divided by BA. So this circuit reaches steady state It also locks in the concentration of these hormones. It's a great homeostatic system for the hormones and keeps the size controlled as a single stable steady state. And it's incredibly robust because these hormones only depend on these two parameters, not on all these other parameters in the fast time scale. So it's very robust to dynamical changes and all that. And this circuit has these remarkable properties. And when you look at it now, like Herbert did several times, you take a complicated system and zoom out and look at it. So let's just look at it on the slow time scale. You see that what you've created is actually kind of an oscillator or a negative feedback loop between two glands that has time scale of a— it's a long time scale. So pituitary secretes a hormone that makes adrenal grow, and adrenal inhibits the hormone that makes pituitary grow. So all in all, it makes a negative loop. And when you analyze it, if you have a small adrenal, makes pituitary grow, and that makes adrenal grow, that makes pituitary shrink. And when you plug in the numbers, you plug in the numbers of the turnover time in tissue, we got goosebumps because we got that the natural period of this circuit is about a year, which you get from 2π over the month timescale of the turnover. And we thought, oh, a year, that's such a nice biological timescale because all the vertebrates, all the animals need to deal with year, a seasonality. Maybe we have here a natural clock inside the body that can follow the seasons, and a lot of animals, almost all animals actually, have a seasonality. So for example, this squirrel here hibernates in the winter, active in the summer, hibernates, active. But even if you take the squirrel and you put it in constant temperature and light conditions, so no winter, no summer, all the daytime is equal— it still does this. So it has an internal clock, but instead of 12 months, it has an 11-month period. It's like circadian clock, not a circadian clock. It's almost 12-month internal clock, and nobody knows where this clock sits in our body, unlike the circadian clock, which we as well characterized. And when you now factor in day length as an input to cortisol, This feedback loop has a very interesting prediction that cortisol shouldn't peak at the shortest day of the year. It should have a delay, and this delay comes from this time for the glands to grow. And the upstream hormone shouldn't be just like cortisol, it should have a phase shift. That's because these two glands kind of oscillate. Oh, I'm trying to—
yeah, oscillate.
So they're out of phase like that, and that's a surprising prediction because Classical models would say that the hormones activate each other, so they should go together and peak exactly the shortest day of the year when you have the highest input to the melatonin input to the circuit. How can you test predictions like this? How can you— and by the way, these oscillations should be very small, just a few percent. How can you test something like that? Oh, and it's predicted also that the more north you are in the world, the larger the day-night variation, the more these oscillation amplitude should rise. So how can you test that? And here I want to tell you about— this is a methodological, methodological thing. When you're dealing with humans, a human is a great model organism right now because there's so much data, basically. And we took Israel data from Israel's health insurance, which covers almost the entire country, 50 million life years. And we have millions of blood tests. We can look at all the cortisol blood tests. Done, so like 90,000 cortisol blood tests, and test where they— when, when are they maximal in men and women, etc. And, and find that they're really maximal in the spring. And we could do that for all— in fact, all those 4 hormones I told you about— sex, growth, yeah, metabolism, and what else was there, stress— and look at all those hormones and get a full picture of So we see that the effector hormones peak in the spring and the upstream hormones peak in the summer. We can get a full picture with millions of blood tests, in some cases, of all the hormones in the system and look at their seasonality. It's really a few percent oscillation, and we find this pattern that the hormones that come from the effector hormones, the ones like cortisol, peak in the spring, and the upstream hormones peak in the summer. And you just get medical— biomedical data to test these kind of hypotheses. And we're very happy. And it also allows us to calibrate the model quite precisely and then open up all this world of medical phenomenon. Oh, we also could— a prediction is that the pituitary gland would now grow and shrink also in volume with the seasons, which we could test by looking at databases of medical images. And basically look in 3D at the volume of the pituitary and see the seasonality, which has the phases that are expected. And also from different studies, we can see this latitude effect.
In Australia, it's in the summer—
it's not in the spring, it's in the fall. It's exactly— but it also works out when you look at the southern hemisphere. And, and this means that maybe human beings have a kind of a sweet season spring for all these different functions: sex, growth, metabolism, which peak together. And there is evidence that in some countries, fecundity and sperm quality, etc., is highest in the spring. It's different in northern latitudes, but in temperate climes, that's the way it looks like. So that's like basically a model for slow time scales that reveal the possible clock that can give you inertia. So even if there's one cloudy day in the summer, you don't think it's winter because your glands are growing and shrinking and keeping track inertia of the seasons, which could be useful in vertebrates. But this can cause problems. Now, when you look at medicine, the same effect can cause problems. So, for example, if you treat people with an analog of cortisol, because cortisol suppresses the immune system, and you sometimes you want to suppress the immune system for people, let's say, with cancer or— or with autoimmune disease or transplantation, people can take steroids, these steroids. If you take them for a few days, it's not a problem. But if you take them for more than 2 weeks, you gotta— you can't stop taking them all at once because you'll be in trouble. And experiments in the '60s showed exactly what happens when you do that. What happens is that your cortisol— if you stop taking these little corticosteroids cortisol is very low. First of all, when you take them, what happens is that the glands think, oh, there's too much cortisol, you're flooding the body with cortisol. So the glands shrink, shrink, shrink, shrink because of the circuit. When you stop the drug, you hardly have any cortisol. It takes 9 months to recover, and the upstream hormone overshoots like that. And you just get that from these glands. This gland oscillator is basically like pulling the oscillator, like pulling a spring and then having it like do a half oscillation. Oscillation with it, it's a damped oscillator, and you get this overshoot phenomenon explaining, and from this you can compute the best way to taper the drugs. So you have these, the glands change and they take a month to recover. And this also explains all kinds of hysteresis phenomenon in thyroid hormones and possibly, this is now just a hypothesis, we're testing now, this could maybe explain things like why mood disorders like bipolar disorder, manic depression, have time scale of months. You know, also depression, you take drugs for months, they work on their neurotransmitters within hours, they still take months to work. And we think part of the time scales might be due to these oscillators. So for instance, we have this data in collaboration with Melvin McGinnis on mood scores. So these are people with bipolar disorder, and you look at the depression mania scales, but this is the only— psychiatrists nowadays can only— the only thing they They have no blood tests. They only work with these subjective reports. And you see the depression and mania go up and down. When you ask what frequencies are there, you can do a Fourier transform and look at the frequency components. And you see that there's plenty of low frequency— low frequencies in here. Of course, we know that these moods swing over months. And We believe that one explanation could be the inertia of the glands. So high cortisol, for instance, one of the side effects of taking glucorticoids is depression and mania-like symptoms. And what we think is that the daily stressors can cause— basically you have fluctuating stresses, but because these glands have a slow time scale, you put in white noise into the model, the glands pick up this year time scale, more or less, months time scale. So white noise inputs can lead to yearly fluctuations with this kind of Fourier amplitude. And then in my lab right now, we're using hair to measure longitudinal cortisol. Cortisol just sits passively in hair, and if you take a piece of hair, every centimeter is about 1 month. So 12 centimeters is like a retrospective calendar of your cortisol. It just sits there, cortisol, there's no function, but you can— we take the hair, we cut them into pieces, and we can measure your cortisol back in time, and we observe that healthy people have this slow time scale of a year in their hair cortisol. And we want to do this now in bipolar patients to see maybe they have higher amplitude oscillations, and we can then think of the HPA model. So what kind of practical use could this be? So I go back to Herbert Sauer's talk about control theory, these kind of hormones, we can envisage these models to help us make a controller. So just like insulin, so you have this— a lot of people with diabetes, type 1 diabetes, have this controller which can measure glucose, and then you inject insulin in order to control glucose. So maybe the same idea: you have your input stresses, and your cortisol goes up and down, but maybe if you make a controller, you can stabilize those amplitudes. So you measure cortisol you compute what you need to take, like say cortisol pills, in order to get the glands back to the best. So you take these pills for a month, you measure it again, maybe with hair, you compute it. And this way, maybe think of a paradigm where you can control your hormone axis to avoid these dysregulations and guide physiology. So I guess take-home message is that if you think of the same kind of mathematics that Herbert described for proteins, but now think about cell circuits. Cell circuits have a slight difference where you need to control proliferation and death. They have to be exactly equal, and that creates very special integral feedback loops that are beautiful, the control properties. And basically can create this network of tissue sizes that can— so our whole body might have adjustment in gland sizes to buffer physiological changes, pregnancy, etc. Seasonality, and this can cause problems with medication and mood disorders, etc. And so that's the whole world we're interested in exploring now.
And that's it. So thank you so much.
That was incredibly interesting.
Yeah, thank you. If I had known like this type of cell circuit modeling approach was going on, I maybe would have made it its own month. Thank you.
Okay, can you exit the share screen?
Yes. Okay, so I have maybe some discussion questions, but first I'll pose it to the audience. Does anyone have any questions for either of our presenters? Okay, so I'll start. Well, something I was interested in is if in protein modeling or I guess cell circuit modeling in general, you think that there's any data that's being underused. I mean, one of the things I think that was so interesting, Dr. Honda, about your presentation was all these sorts of data I never would have thought to be used in modeling like this. The size of glands, we're able to use to validate certain models. So my question is, is there any data that currently exists that either of you think should be used, or what data is necessary to go create to drive this field forward?
Herbert, why don't you start? Yeah, OK. Yeah, so I have an issue with existing data. Part of the problem, at least the first part of the problem, the area I'm in, data comes from all sorts of different cell lines. And the different cell lines are actually quite different in how they behave. And if you are going to use existing data, it's very important that you make sure you're collecting data that are comparable and can be used together. So this is a big problem. So the project we're doing at the moment, I have two— I have access to completely new data that will be collected specifically for this modeling project. So I'm of the view that you start with a model, and then you decide what data you need, rather than trying to sift through data that already exists. Now, Yuri was lucky, though. He managed to get all sorts of data from the literature. But in our case, it's difficult because there are so many cell lines, so many different conditions. That it's very difficult to compare and contrast different data sources. So you have to be very, very careful. Otherwise, you end up with a sort of Frankenstein model that's been calibrated with all sorts of different things.
Do I continue? Yeah.
I agree.
When I was doing models of proteins and gene regulation, it was very gratifying to do our own experiments because You had to make the experiments suit the data. And I also agree that it's very useful to start with a model and a question and then seek the data. It was surprising to me in the field of human physiology how much— once you pose a question, how much you can reuse previous experiments in new ways, and how this biomedical data, which is so noisy, so it has ascertainment bias, etc., You can still use it to ask precise questions. I didn't expect that. And so I'm guessing that the kind of data from the point of physiology will be very useful is to have these healthy people followed over long times and measuring many things so that we can understand health. First of all, the different ways people can be healthy and also what things go wrong long before you can clinically see it. You see in illness. And that kind of data will be very important in order to understand dynamics of, of human physiology. I also want to say that in this field right now, we have to use minimal models. So you can use a Frankenstein model, which means trying to put in everything known. But then what you get is overfitting because you— a lot of different parts of the equations go to do the same thing. And then you get this sloppy model problem where you So it's very actually appropriate to use a minimal model, that is to say, lump together all the effects that go in a certain way with effective parameters, because, because then you can have much more power to understand. And, and then what happens is a lot of different biological processes get lumped into one parameter, and that could be transformative, I think, in understanding how to go between the genes and protein detail and the physiological outcome. You need these intermediate parameters that chunk a lot of a lot of information inside. And I said in physiology, I think the level of protein reactions is much more chance to go into absolute detail, but also you need these different levels of understanding, like Herbert showed. There's a hierarchy of models, basically, that trade off understandability, precision, depends on what scale of question you want to ask.
Yeah, interesting.
Thank you.
We have time for Oh, sorry. Sorry, yourself.
Yeah, sure.
I have a question to follow up. So, uh, Dr. Elan showed that you can make predictions that were very physiologically relevant. I'm wondering, are models at a point where we can actually use them as translational tools to guide treatments? How much confidence do we need to have to be able to do that in the clinic?
And so the translational step, and as scientists tend to think quite optimistically, So the translational steps require basically, as a rule of thumb, testing your idea on 10,000 people. Why? Because the human variation is so huge. But there is an intermediate step, which is research. So for a long time, minimal models guided research, like glucose-insulin loop. There's an equation. That allows you to calculate glucose insulin resistance, and that equation just from simple blood tests is used in thousands of research papers to understand insulin resistance, which is very important in order to understand type 2 diabetes. So for research, those minimal models can be a guide, they can generate new experiments, and I think there's a, a few examples now in medicine where mathematical formulas have been translationally validated and and really affect the way doctors work. I think that will change dramatically in the next decade because of the huge amount of biomedical data and interest in this. So I think it's a huge opportunity. But I just want to say, for basic research scientists, even making a formula that impacts other researchers is a huge step. And then it takes a special skill to translate that into something clinically useful. I just want people to know the magnitude of that. It's a huge undertaking because you have to cover the variability of the human phenotype. You don't want to miss 1% of people. They'll get, you know, you'll miss, they'll get a heart attack or God forbid or something like that. And rightfully so. Okay, so did I explain myself well?
Thank you. All right, well, it's time to wrap up this month's seminar. Thank you so much to our speakers, Dr. Sauer and Dr. Alone. And thank you everyone for coming. We hope to see everyone next month.
Thanks very much. Bye-bye.
More from Joshua







Scientist Stories: Hans Waterham, The value of phenotypic assays in peroxisomal disorders




Scientist Stories: Joel Zlotogora, Genetic carrier screening programs for reproductive purposes