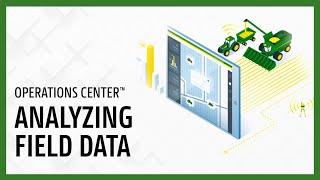
Learn how to use John Deere Operations Center's Field Analyzer and Work Analyzer tools to review fieldwork data, compare maps, check equipment and operator performance, and export reports for your crop operations.
As you prepare to make decisions for your operation throughout the growing season, you.
Need to understand what is driving the.
Performance in the field. Analysis tools in Operations Center, Web and Mobile let you dig deeper into the powerful data you gather during fieldwork row by row in high definition.
In this video, we will discuss how to use the Field Analyzer tool How to use the Work Analyzer Tool and.
Analyze an Operations Center Mobile Field Analyzer is your tool in Operations Center Web to evaluate and compare fieldwork maps. Navigate to Field Analyzer by going to the Analyze menu. In this example, we'll select a corn seeding operation. In this view we see an overview of the map, but we could also compare or overlay this map on top of another map if needed.
Start by selecting a map layer to.
Concentrate on the data that is most important to you. The map layers available in Operations center vary based on operation and machine types. For a complete list of map layers.
Check out the link to our Help.
Article in the video description. Take a look at the Summary tab to review all the details related to your work data. Here you can see when the operation was started and finished, work totals, equipment, performance varieties, and what machines were used to complete the work. On the map you'll notice the legend which helps you identify low and high performing areas of the map. Zoom in to get a better look at the performance at the zone level. If you want to evaluate a specific zone or field trial, use the Drawing tool to draw a shape around the zone. Then you'll see a summary for the selected zone. Let's take a look at the Compare feature. We will compare a yield map versus a variety map to see which varieties performed well. To investigate further, you could check out the Data analysis chart to review harvest productivity, total yield, moisture and more. Just click the Share Export button to print or share an operation with a partner organization.
Work Analyzer and Operations center is your place to review work data across multiple fields and organizations. Here your data appears as a table so you can check for trends, sort, filter and generate reports. In this example, we'll look at some harvest data. We will select a crop type and can sort by the year that we wish to analyze. Starting out on the Fields page, the table features headers to change the columns from ascending to descending order, and there are helpful filter chips to narrow down the results in the data table. For our report, we will use the Fields filter to identify three fields. We now have a table that shows our field names, crop types, acres, harvested yield, and more. Select the Map icon if you want to see the maps in Field Analyzer the Work tab is helpful when there are multiple of the same type of operation done in the same season on the same field. This will separate the field level data into totals for the individual passes. A good example of this is when you would apply a pre emerge application on a field, then come back later in the season and apply a post emergence application. Then may be followed by a fungicide application. Each one of those passes would be broken out into separate rows with individual totals. Switch over to the Varieties page to better understand performance of the varieties. You can use this page to do things like identify which variety had the highest yield or lowest moisture. Switch over to the Equipment tab where.
You will be able to see season.
Totals broken out by each piece of equipment. You may want to know how many acres each machine has done this season for repair reasons. Or switch over to the Performance where you can see how the machine performed across the season. One machine may have covered more acres, but was it more productive getting more acres an hour? Clicking on a machine pulls up a list of fields that specific machine worked on, providing more context behind those metrics. The last tab is Operators where all the work done is broken out by operator. This data comes from the display when the operator enters their name into the work setup. Do you know who your top operators are? Work Analyzer can answer exactly that question. One operator could be going too fast.
And leaving crop in the field.
You can export your findings as a PDF or Excel report using the Export button. The Field Report option lets you download or print a report that includes maps and summary data for a group of fields. Analyze and Operations Center Mobile is your tool for on the go analysis and data editing. The table sorting and filtering functions in Mobile are similar to web. If you select a field, you can easily navigate to the map where you view work data, equipment and weather data from the operation. This tool offers unique editing capabilities so users can edit data for a single field or multiple fields at a time. This can be especially helpful when reconciling harvest data with scale tickets. There are many informational articles to help you as you use Operations Center. Navigate to the Assistance menu and select Help Documentation. In this video you have learned how to analyze your field and work data in Operations Center. Thank you for watching.