Matthias Kmeyer walks through John Deere Operations Center to plan and execute variable rate applications of growth regulators. The process starts with satellite imagery to create prescription maps, then moves to operating the tractor and reviewing application data after the job is done.
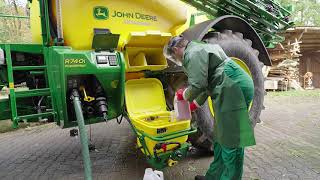
I'm standing here with Matthias Kmeyer. We're in the field of rape that's been seed a few weeks ago, and now we want to protect it from the weather that's coming this winter. Therefore, we want to apply a growth regulator. And the rate we want to apply it with is depending on the amount of plant material that's standing. There's some thicker spots and some thinner spots in the field, as we can see. We will use the app of Solaro. It's just an example. There's many other companies that provide such a service. And based on satellite imagery, we can create a variable rate map. Like we said, we're going to use the app of Soloro. It's just as an example, to make a variable rate map of the field we're currently in. It's done quite simply and we can send it straight away to John Deere Operations Center. So now it's time to plan a new job. We're using operations center on the tablet. We go to plan, select the kind of work we're going to do. In this case, it's an application, and we say plan application. Over here we have to select a product that can be a single product or a tank mix. In this case, we already prepared the tank mix. We select it from the list. Over here we can enter more details. So we select the machine. That's our six R140, the implement, the driver. And over here we can add comments and instructions. So also filling instructions for the operator. We press next and we have to select the field. We can use the list and the search function to find the field, but we can also use the map to navigate to the field where we're going to work. We select the field and press next. Over here we have to enter the field details. So we will include the guidance tracks. And now it's time to select our prescription map. That's norm. Over here we say add prescription file. And now we can find the file that we just sent using Solaro. We select the proper file and press save. We say add work. And now our planned work is ready. The next step is to send the planned work to the machine with the three dots. Over here we say send to equipment, select our job, say next. Here's a list of the machines we want to send it to. And we press next. If we want, we can change the name of the work file. In this case, we just press send. Now the work is being sent to the machine, and in a few moments it will be ready to download in the tractor. So We've sent the work data with operation center to the tractor. And now this symbol on top here shows there's new data available and we want to import it. That can be done by clicking it here straight away or via the file manager. So here we see receive files and files are ready for import. We select import from received files and we select the work data that we've just sent. That's the one on the top here. Setup data is available and we press import and the data has been imported. So we've sent a new job to the tractor. As soon as we enter the corresponding fields, this window will pop up. The field is displayed right here. After pressing work details, we can see we're dealing with an application. Two guidance tracks have been sent. A field boundary has been sent as well. And here was room to include a driver name behind the button. Product Application. We can see there's a prescription map present. If we swap to the other window, we can see that the application map has been loaded. The field name is shown over here. If we change the orientation, we can see the complete field including the application map. A guidance track has yet been selected as well. In order to use the prescription map, we have to enter a few more settings. Therefore, we go to setup, choose the prescription map and go to the settings of the map. We've made a generic prescription map based on an average rate of 100 liters per hectare. We've done this to be able to use the same map for different applications on this field. In this case, we want to apply 200 liters per hectare. So we put the multiplication factor at 200%. Next we can configure what has to happen when the GPS signal is lost or if we're outside the range of the rate. Map over here is shown that when there is no GPS signal, the last known rate will be used. If we are outside the rate map, we want a rate of 100%. We confirm this with OK. Over here we can select how the application rate will be determined based on the different zones within the boom. Width. We can choose for the average of the different zones. We can choose the highest or lowest rate, or we choose the most common rate. In this case, we pick the most common rate. Next we save the settings and confirm this with ok. Over here we can see that the rate at this pot in the field is 192liters per hectare. Now we are ready to start spraying. We finished spraying. The field on the map is shown that there are areas where the application rate was higher and there are areas with a lower rate. In a few moments this map will also be available in Operations center. Since we are ready with spraying the growth regulator and the tank is close to empty, we will now start the auto dilute system to clean the inside of the tank. In this case, we will select the minimum rinse program. Clean water is now pumped into the system. And next the valves will be controlled automatically to rinse the inside of the sprayer. There's 115 liters of diluted mix in the tank, which we can now spray onto the field. On the homepage of Operations center. On the tablet, we can see there's finished work. We can see it by this bar. If we click on it, there's already a few details visible. And if we press map we can find out more. We can see that the data has been sent to about the applied rate. And we can see there's areas where it is more applied and areas where the application was less. We can also change what's visible on the map. For example, the speed of the tractor. Now we highlight again the applied rate. If we press the little arrow here, we can find further details about the application, like the total amount of liquid applied to the field. If we press equipment, we can find some performance details about the tractor. For example, the fuel that's being used.