This is a YouTube video titled "John Deere Protein Analysis with the Rethus'" containing a multi-speaker discussion focused on agricultural protein mapping and crop quality analysis. The speakers discuss the importance of real-time protein data integration with yield maps to optimize crop profitability and nutrition management. The conversation centers on how protein segregation affects crop grading and profitability, with insights into variable rate seeding and fertilization strategies. The participants appear to be experts or practitioners in agricultural technology and crop management. There is no indication that Francisco Jimenez is one of the speakers.
Protein maps are one of the things.
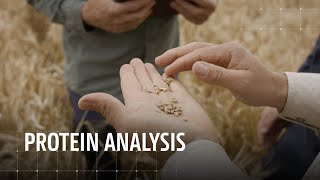
We'Ve been really looking for in the past because you get paid on quality. Bringing that layer into the operations center was a big start. There are other protein meters available, but they don't communicate with the platform and they don't have access to the data. So being able to just grab all that information, having it real time, it's mapping it live, it's mapping it at the same time as it's doing yield. So you can do that. Real time analysis is really important. In Australia the biggest thing is protein segregations. You could grow six tonne of fantastic barley and it was all feed one, which is good quality, or you could have grown malt, which is the top grade and there's a dollar difference in that. And were you better growing more of a lower grade or less of a higher grade. But that comes down to the analysis at the end. When you're looking at your maps at the end of the year, which was more profitable and that's what we're looking for. Adding that protein layer helps us better understand whether that area was actually just the highest yielding or whether it was the most profitable.
Well, an example last year was we had some crops that finished with some very high protein and when you go to deliver there is actually ends up being a cap on the amount of protein that you get paid on and then after that you don't get any benefit. So, so we had some very high protein that we could segregate and actually blend that with some lower protein to bring that up and otherwise we would have been not able to do that.
It's going to help down the track for our nutrition management as well. If you've got a field that's got high protein areas and low protein areas, why was that? So the high protein may have been because you over applied nitrogen and the crop is burnt off. The low protein, if it's below your 10.5%, you probably didn't put enough nitrogen out there because you need to get it up to that 10.5, 11% to optimise your yield.
We want to know how this hectare of crop is performing. We want to know that it is delivering the best it can in this area. And we need to know what the grade is, which is the crop quality, which is where the protein meter is helping us. Not just the yield. Then we've got our other layers, we've got our variable rate, seeding rates or our fertilizer maps. We can layer that over the top and then the dream is that we'll have this map that's essentially telling me this was a profitable paddock. This piece of field did the best it possibly could. That's where we're trying to get to. And this protein harvest lab is a step on the way to getting there.