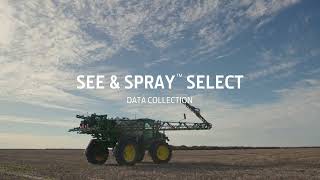
This is a YouTube video titled "John Deere See & Spray™ Select: Data Collection" created in February 2024. The content features a detailed explanation by two speakers about the See and Spray Select system, focusing on how it collects and uses data for targeted spraying in agricultural paddocks. The discussion covers live coverage maps, weather data collection, and data integration with the OP center for reporting and sharing with third parties such as agronomists or accountants. The video is educational, aimed at both existing and new customers to optimize the use of the system for efficiency and productivity.
This is a series of videos on See and Spray Select. It is designed for existing customers and new customers to see and spray, to educate on how to set the system up, what the components of the system are and how to get the most in terms of efficiency and productivity out of your machine.
The John Deere system collects data in two separate ways. So what we have live in the paddock while we're targeted spraying, you're getting a coverage map that's showing you where you have and haven't sprayed. You can think of that coverage map as like a weed map because we only spray the weeds in the paddock, it's showing you where your weeds are. You will also, in the cab, in our Totals app, see how many acres or hectares you've been over, as well as how many of those hectares you've actually sprayed. So you may have covered 100 hectares, but only sprayed 25. So the other data we are collecting from the machine comes from mobile weather. So when we have a mobile weather system mounted on the machine, we are collecting live weather data across the paddock. So that is wind, wind speed, wind direction, temperature, delta T, all factors critical when we're spraying. So that is live in the cab. And there's also data log behind the scenes. So if you do need that information in the future, it's there able to be collected. So the second thing we can think of with data with the SEE and Spray select system is what goes back to the OP center. So everything you collect live and you can see live in the machine, then goes back to the OP center. So when you log on and go into that paddock, you will see that coverage map that shows where you have and haven't sprayed across the park paddock. You'll also see those figures that will tell you how many litres of chemical that you should have used in that paddock, how much you've saved. So with that data in the OP center, it can also be shared as a report to a third party, such as an agronomist or your accountant or a farm adventure.