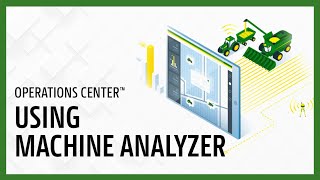
Learn how to use Machine Analyzer in John Deere Operations Center to track equipment performance. Monitor fuel consumption, utilization rates, and create custom data views for your JDLink connected machines.
Machine Analyzer in Operations Center Web shows you equipment and technology usage data from your JDLink connected machines so you can better understand the performance of your fleet. In this video we will discuss how to evaluate equipment usage and how to create custom views so you can see the data that is most important to you. To get started, open Operations Center Web and navigate to the Analyze menu. Then select Machine Analyzer. Select which organization you would like to view in the Organization selection drop down menu. Here we have several pre populated views that turn the JD Link data into different reports. Use these views to analyze many factors such as fuel performance and precision technology usage. You can view the data by each machine type or group by organization. Use the filter chips to create your report. Select your desired date range and choose the types of machines you want to analyze. Lastly, select the active machine filter and you can start viewing your data. Expand the machine type so you can see the different models in the organization. Once you expand the model numbers, you can see each individual machine in the performance view. We're looking at utilization or what percentage of hours are spent working, idling or in transport for each machine. You can use this information to identify which machines are over or underused. Now we will change to the Fuel usage view. Here we can see the amount of fuel consumed by a machine and the average amount per hour. The dotted line indicates the model average and the solid line indicates the machine average. Next we will create a custom view. Navigate to the View drop down menu and select Create new view. There are many data points to choose from so you can see the data that is most important to your operation. We will create an example view for combine harvesting. We will select some key combine metrics including average graph ground speed and average engine load and some key precision technology metrics. You can prioritize how these metrics will appear in your view and save. Now we have a custom view of our key combine harvesting metrics to better understand how each machine is performing in the field. Remember, you can build views for all different types of JDLink enabled machines. Here's a custom view we created for our application technology. If you want to export or print the data you see in Machine Analyzer, select the export button to generate a spreadsheet or a PDF. There are many informational articles to help you in Operations Center. Navigate to the assistance menu to check out our help documentation. In this video you've learned how to evaluate machine usage in Operations Center. Thanks for watching.