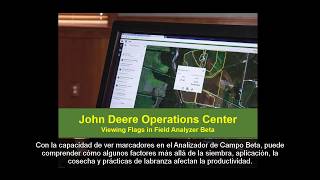
This is a YouTube video titled "Visualización de Marcadores | Analizador de Campo Beta | John Deere" created on March 26, 2020. The video provides a detailed tutorial on how to use the flag viewing feature in the Field Analyzer Beta tool to evaluate field performance and understand factors affecting crop yield, illustrated with an example of a farmer improving yield through drainage tile installation.
Today we will show you how to view flags in Field Analyzer Beta and how a grower might utilize this function when evaluating field performance. Understanding what factors affect yield is important. With the ability to view flags in Field Analyzer Beta, you can now understand how some factors affect yield other than your typical planting application, harvest and tillage practices. In this video we will look at an example of a farmer that was able to see how installing drainage tile affected his yield. To begin, we will go into Field Analyzer and select the field that we wish to analyze before launching Field Analyzer Beta. Once loaded, we will then go into the filter function at the top left hand corner of the map beside the legend shown here and turn on flags. By selecting the Show Flags checkbox, you can filter the flags by type, area, line and point category such as rocks, weeds, or in this case tile size and finally date range of when these flags were created. If you select a flag on the map, you can view details about this flag on the right hand side. It should be noted that you cannot edit flags within Field Analyzer Beta. They are view only. If you wish to edit the flag, you will have to go to the Land Manager tool. The flags are also only viewable in the overview mode at the top of the screen. I'll go ahead and hide the flags for this field for a moment so that we can see that this field shows the average dry yield in 2014. For this example we are going to use a legend template to compare over multiple years. As you can see, this field averaged 170.19 bushels an acre. To try to get some more information, let's look at the elevation data with the overlay function onto the yield map. Here we can see that there is a low spot on the east end of the field and if we move the opacity of the elevation we can see that the low spot corresponds to the poor yielding area of the field. The farmer then concluded that the field was having drainage issues and installed tile in 2016, shown here by the line flags overlaid on the 2014 yield map. Now let's use the compare functionality and look at this lower section of the field with the subfield selection tool shown here. Now we can see that this section yielded 159 bushels an acre in 2014 and in 2017, a year after the tile was installed. This section of previously lower performing ground shows that it yielded 233 bushels an acre, a significant increase. Also we can see this section yielded higher than the whole field average in 2017 by over 20 bushels an acre, whereas in 2014 this section of the field was 10 bushels an acre under the field average. This farmer is now able to see the effect that his decision had on his yields due to the new flag viewing capability in Field Analyzer Beta. Now you can too. Thanks for watching.