A no-code workflow automatically generates LinkedIn posts and graphics from a single topic. It uses Tavily to find statistics, an agent to write the post, and OpenAI's image API to create a branded graphic. The presenter says it saves up to ten hours per week on content creation.
Chapters
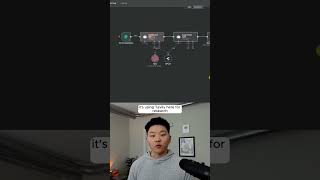
Here's how to use OpenAI's Image API to save you 10 hours per week. So this workflow right here, all I had to do was enter in ROI on AI automation, and it was able to spit out this LinkedIn post for me. And if you look at this graphic, it's insane. It looks super professional. It even has a little LinkedIn logo in the corner, but it directly calls out the actual statistics that are in the post based on the research. So 74% AI initiatives meeting or exceeding ROI and 26% significant AI-driven gains. And for this next one, all I typed in was mental health within the workplace, and it spit out this post According to Deloitte Insights, organizations that support mental health can see up to 25% increase in productivity. And as you can see down here, it's just a beautiful graphic. Anyways, let's do a quick live run of this workflow and then I'll walk through step by step how to set up this API call. Okay, so this form is waiting for us. I put in my email, I put the topic of morning versus night people, and the target audience is working adults. So we'll hit submit, close outta here, and we'll see the LinkedIn Post Agent is gonna start up. It's using Tavily here for research and it's going to create that post. And that image prompt agent is gonna read the post and basically create a prompt prompt to feed into OpenAI's image generator. And as you can see, it's doing that right now. Okay, so all that just finished up. Let me pop over to email. So in email, we got our new LinkedIn post. Are you a morning lark or a night owl? The science of productivity. I'm not going to read through this right now exactly, but let's take a look at the image we got. When are you most productive? In the morning, plus 10% productivity, or night owls thrive in flexibility. I mean, this is insane. This is a really good graphic. If you want to watch the full video, click the button right here, and I'll see you guys over there.