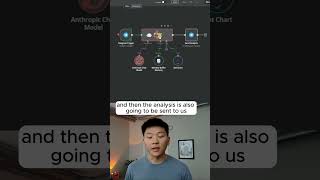
A no-code AI analyst built in n8n takes a stock ticker, pulls chart data, sends it to Claude 3.5 for technical analysis of candlestick patterns and MACD, then returns the analysis and chart image via Telegram.
Chapters
I just created this financial analyst in N8N using no code. Okay, we have our AI agent right here ready to go, so we're going to send off this text that asks it to analyze Apple. It's going to send that stock ticker to this tool that we created in N8N called GetChart, and then it sends that back to the agent to use Anthropic 3.5 to actually make that analysis a little more in-depth. We already got the chart back in our Telegram right here, and then the analysis is also going to be sent to us in Telegram. As you can see, it's pretty in-depth, It basically breaks down candlestick analysis, downward trend highlighted by recent consecutive red candlesticks. Then it breaks down the MACD, talks about the signal line, talks about the histogram, and then it goes into volume, and finally support and resistance levels. And then finally it goes into, it's important to note that this analysis provides a snapshot of current market conditions but shouldn't be considered as financial advice. This isn't really a financial advisor, it's more of just giving a brief financial analysis as well as a technical analysis on whatever stock you enter in there. If you want to find out how you can build this or even just download the workflow for free, then watch the video on my channel.