Oura Self-Quantification Ring Cloud Feature
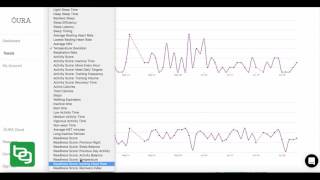
Ben Greenfield walks through Oura's new cloud dashboard, showing how he tracks sleep latency, REM and deep sleep, HRV, and readiness score. He compares metrics like vigorous activity against sleep latency to spot patterns in his recovery and behavior.
Foreign.
Hey, it's Ben Greenfield. And I have been receiving plenty of questions about how exactly I access all the secret insider information that my mighty powerful cereal box Oura ring gives me. So I wanted to pull up the brand new Oura cloud to just show you how many cool things I've been able to harvest from the data that this, this device on my finger is monitoring and collecting 24, 7 with. Remember the cool thing being that it's in airplane mode, there's no Bluetooth signal, there's no wifi signal, I'm not constantly irradiating my body. And in this video or where you're watching this video, I'll put links to other resources and articles that I've written about why I use this ring, why I purchased it a couple of years ago, and why it's my go to self quantification device. What you are looking at right now is the brand new aura cloud, meaning that when you wear this ring, yeah, you have an app, but then you also have the cloud that you can log into on your desktop or your computer or a phone browser and you can actually pull up a host of additional data that you actually don't get from the actual app itself. What you're looking at right now is just the main dashboard. Now, the main dashboard shows me just a few basic things like my lowest resting heart rate, which is an indicator of recovery, my total sleep and my sleep quality, my calorie intake or my calorie activity, et cetera. But what I want to show you goes far above and beyond that. For example, I'm going to go down here and I'm going to click on trends. Now, once I click on trends, here's the cool thing I can look at. Check this out. My sleep score, which is a mix of my total sleep, my REM sleep, my deep sleep, my efficiency sleep, the peacefulness of my sleep, or what's called the tranquility my my sleep latency, how long it took me to fall asleep and my sleep timing. Let's go ahead and just look at one of these. For example, let's say I wanna look at sleep latency. How long does it take me to fall asleep? Well, you can see that this would be for April all the way up to the time that I am filming this screenshot for you up till June 29, that my sleep latency, with 100% being a very good score, falling asleep very quickly, and the lower scores being worse, like taking a very long time to fall asleep, they basically fluctuate. You can see here When I went through a period of time, this was actually intense travel that I had. During this time, the last little part of May, I had a very high amount of sleep latency, meaning it was taking me a long time to fall asleep. There was one night here where it took me a longer time to fall asleep. I can go back and look at what I ate these days, what I supplemented with these days, or let's say I want to compare this to. How about we see if my sleep latency is, has anything to do with my amount of vigorous activity time? Right. So how hard I worked out during the day, does that affect how long it takes me to fall asleep at night? So I pull this up and all of a sudden I can compare my vigorous activity time with my sleep latency. Well, this is kind of interesting because it would appear if you look at some of the peaks in my sleep latency, it appears that the more vigorous the days of activity that I have, the shorter a period of time it actually takes me to fall asleep. You can see that these peaks in my vigorous activity time actually correlate pretty well with an increase in sleep latency, which is actually something really interesting. So it turns out if I work out hard, I'm actually going to fall asleep a little bit better that night. I mean, you can see here where I had almost no vigorous activity, how long it took me to fall asleep. So this is really interesting. Well, as you can see, there are a host of additional things that we can get. I'm going to go ahead and hide this chart and then I'm going to go up here to this chart. So I showed you sleep latency. We can look at sleep timing. We could look at, for example, my REM sleep, how much time I spent with my rapid eye movement, sleep, etc. But then another thing I can look at here would be, for example, my lowest resting heart rate and lowest resting heart rate is a really interesting corollary for recovery. Meaning that the lower your heart rate gets during the night, the better an indicator it is that you recovered. The higher it gets, typically means you had a big meal close to bedtime, you had difficulty sleeping, your body temperature was sometimes high. So I could look at my lowest resting heart rate at any given point throughout the past several months. And the lower it is, the better it is. But let's say I wanted to see how this corresponds to, lets say my body temperature, which this ring is measuring all the time. So I'll go to my actual body temperature, which is going to be.
Temperature deviation. Yeah, Temperature deviation. So this would be my actual body temperature. And we can see is it body temperature? No, I'm looking for.
Where is it? I need my actual temperature. Here we go. Readiness score temperature. Alright, pull up for me here, Pull up for me here. I'm filming this video like right when they came out with this.
New cloud. So that might be why it's not pulling up temperature. So let's go ahead and just go with something out respiration rate. Okay, so here's my respiration rate. Oh, there we go. Temperature deviation showed up. Just took a little while to do it. Okay, so now we can see my temperature deviation. But actually what I want to do is go to readiness score temperature. Okay, so here's my temperature throughout the day or throughout the 24 hour cycle. And we can see that the changes in my temperature can correspond to changes in the actual heart rate. Meaning that if I were to keep my bed cooler or sleep on a chili pad, or not work out really, really hard super close to bedtime, these are all things that would affect my actual body temperature. Which it's another thing that aura feeds into my readiness score. So every morning I wake up and it tells me how ready I am to tr. And part of that's based on my lowest resting heart rate, part of it's based on my temperature, part of it's based on my previous day's activity. But then the other interesting thing is we could look at respiration rate, right? A low respiration rate is actually correlative with increased longevity. And so I think this is interesting because I can look at my respiration rate or like how quickly or how slowly I'm breathing and see how it affects, let's say something like my nervous system, right? So my ring will track my hrv, my heart rate variability the entire night. So I could go down here and I could see, okay, look at this. My respiration rate when it rises up to close to 13 breaths per minute, look how low my heart rate variability goes, right? Or when my respiration rate is very, very.
Low. Like in here, we see some fluctuations in average heart rate variability. We can see also a stepwise effect in my training. For example, here I raced a spartan race and I really trained hard the week before. You can see I dug myself into a nervous system hol. Then I recovered, I super compensated and I bounced back to be able to race on this day. But basically HRV is a predictor of injury. It's a prevail predictor of illness. It's a predictor of your nervous System readiness. And so it's really cool to be able to correlate my HRV with different parameters as well. For example, I could even correlate if I hide my resting heart rate graph here and I hide my respiration rate here. I could take a look at how my HRV corresponds to something like my temperature or any other measurement of my readiness score, let's say, such as my activity balance. Boom. Okay, so we can see how the amount of activity that I get actually corresponds to my heart rate variability or corresponds to my total sleep time or any other parameter. So you can see that there's just a ton of different things that I can check out here. You know, inactive time, for example. You know, and by the way, these white spots are days where I probably had my ring off or wasn't wearing it, took it off for some reason. The times that I would take it off would be, for example, if I have. If I'm doing, let's say, a very cold water swim where my fingers shrink, I'll take it off and then I'll take it off during my spartan races because I just don't want to damage my ring because it is an investment. These rings are. I mean, they're, you know, they're like 400 bucks, something like that. So anyways, though, so you can see my inactive time, right? In terms of how much time I am not exercising or not spending time in vigorous physical activity. And most of this time would be sleep, right? So this includes sleep. So you can see that, you know, my inactive time peaks at certain times. And. And it doesn't correlate that well to heart rate variability. Right. My lowest heart rate variability wasn't during my period of the most inactive time. As a matter of fact, during the most inactive time, I had a decent heart rate variability, but it seems like my heart rate variability dropped when I had, like, less active time. So again, really interesting things that we can look at here. So tons of stuff you can play around with here. You know, non wear time, low activity time. They just added a new feature to the app where you can. You can go back if you weren't wearing your ring for certain activities. Like, let's say you don't like to wear it while weightlifting. You can take it off while weightlifting. Then you just press plus on the app afterwards and you add back in and you say, hey, I waitlifted. And you say how long you did? And then the ring takes that into account. The other kind of cool thing is if I click on my account or, yeah, my account I can go to website like any of the third party apps like We Are Curious. So what We Are Curious does is it allows this, this website called We Are Curious to take all of your data and your charts and actually do projects, meaning studies. You can, you can be in a study and their software detects patterns or correlations to free to decide whether or not something is interesting. There's a ton more that you can do with this. If you want to figure out how things correlate, you know, to your food, to your supplement. Because Curious allows you to keep track of all your food and everything, then you can take that and you can actually bring in your Oura Ring data and, and link it to your food, to your supplement, to different types of workouts that you do, et cetera. So that's basically the Oura Ring Cloud dashboard. The Oura Ring Cloud dashboard. Now, like I mentioned, underneath this video and also where I published this video, I'm going to give you a link to a lot of the articles on the podcast that I did with the folks who designed this ring. So you can kind of go in and look a little bit more at it. There is a, I believe the discount code is bend that you can use for the ring. That'll get you some good deals on shipping and a little discount knocked off if you want that. But ultimately I'm a huge fan of this thing and I hope this has been helpful to kind of help you wrap your head around this new cloud.
More from Jeffrey



The Solution to Aging Might Be Closer Than Anyone Realizes - With Ben Goertzel