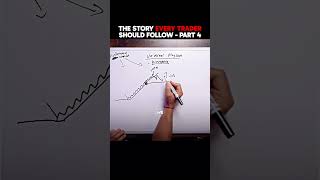
Kardec Trader breaks down S&P 500 price action using trend lines, all-time highs, and liquidity levels. He argues that different trading techniques like trend-line trading and order-block approaches tell the same story. A trendline break, retest, and 10% drop illustrate how fundamental catalysts and liquidity dynamics work together.
Chapters
We had the S&P 500 rallying from the election. We rallied into the inauguration. We have this trend line. This now becomes all time high which is a key level even though it didn't exist before because it's a new high. We broke that trend line and we retested it and we went down on the S&P 500. One of these old lows. This is where we stopped at the distance between here and here was minus 10%. This is another fundamental catalyst. So this right here was a protruding low is a form of liquidity. And this where the market rejected off all time high. Fundamental catalyst retested the trend line. We dropped to that 10% level. On this trendline break. We had a market structure shift. So I don't care if you are trading trend lines and you played the retracement into the trend line or you're trading market structure shift and you are trading the retracement back into an order block or fair value gap, you're really using multiple strategies to tell the same story.