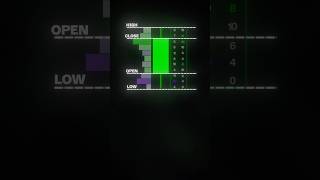
Short instructional piece describing 'deep candles' (also called order flow candles or footprint) which reveal individual orders inside a time-bar, contrasting them with traditional OHLC candlesticks. Explains how deep candles and heat-map/order-flow bubble visualizations show aggressive vs passive trading, absorption at tops, and trading signals; offers a call-to-action to request a free guide by commenting.
Chapters
Candlestick chart were invented in 1850. In 2025 you can look behind the candles. This is called a deep candle, also known as order flow candle or footprint. Instead of giving you four pieces of information the open, the high, the low and the close of price in a specific time frame, a deep candle will show you the real story of every single order that entered the market. A candle like this with a very green color and volume shows that buyer accepted paying higher prices the whole time and that's a good indication that prices could keep rising. But the same candle could sh show an absorption at the top where aggressive buyers are trying to push but they're being absorbed by a passive seller. This could be an indication that sellers are starting to be in control and you might want to exert caution. You can also not have the candle to begin with and have order flow bubbles displayed in a heat map. The heat map shows you passive liquidity resting orders in the order book. The bubbles are people who bought, market or even stop orders who chose to accept the liquidity offered in the heat map. If you want to learn more about how to use order flow in your charts, comment order flow and you'll get a free guide in your DMS.