This is a short transcript of a trading tutorial (YouTube monologue) describing a specific rule for identifying 'logical liquidity targets.' The speaker explains using premium/discount ranges, liquidity sweeps (liquidity being taken at highs/lows), and multi-timeframe reference points (9am/10am highs, hourly and four-hour highs) to anticipate price manipulation and reversal setups. The rule emphasizes treating swept liquidity as a new premium/discount boundary and waiting for characteristic price behavior before reversing.
Chapters
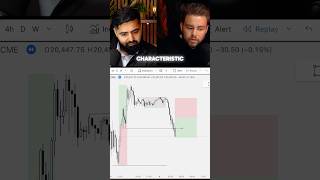
I refer to this as the logical liquidity target, which is basically if we're marking a premium discount range is the first high or low in that 50% drop once we hit that area overall, I'm waiting for price to show a characteristic for us to reverse. And ultimately what I'm looking for is I'm looking for that characteristic to form. In my head. This high right here is the high. So I don't care that this is the high or I don't care about this one. I care about this is because this at 2 o' clock swept that liquidity where I use that divergence. Because in my head, my logical perspective, I'm treating this as that this liquidity has been swept and we should not return down there. So that is the new premium discount range that I want to see. So we've traded way into discount. And then what I'm waiting for, we front ran previous day low. So to me this is just engineered liquidity. We're now inside of premium. We've got that 10am so if we mark out the previous 9am high, which is right here, that's our hourly PO3. So right now this is the area that I want to see price manipulate into and trade away. We're skipping something that is a daily. Did we take a previous day high? No, I'm still expecting trade into some sort of low. Right. And then if we go on to the four hour, but we mark out that previous four hour high and if we go back to the hourly, that previous four hour high is resting just around the eq. And then what I would do is I would say, okay, we've hit that hourly high at 10am now what I want to see is, I want to see price break down.