DAX CRASH? Why I went SHORT while everyone else was LONG (Trading World Champion explains)
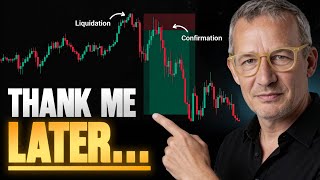
Kardec Trader shorted DAX futures while the market looked strong, using footprint charts and order-book data to spot liquidity pockets. He risked 20 points for a 3.6:1 reward ratio, betting that a 40-45% hit rate on counter-trend trades still turns profitable with proper position sizing.
Chapters
First trade in the morning, stop loss. What a bullshit. But then I changed the system and I give you the real numbers I have done. It was a very famous counter trading session in DAX future in this morning time and it was amazing. I give you a lot of explanations what I have done, what are my thoughts, how is my feeling about it and what was the biggest reason that I take the stop loss step by step on other places with logic behind, not with only numbers. I. I think this video will be amazing for you. I hope you like it. Let me like here and I translated it with AI. It's easier for you to understand because I'm not an English native speaker. I think you will love it.
So a very special situation here. DAX future. I'm entering a short trade right here. Even though the market looks extremely strong, I can clearly see that there's no liquidity left. For the first position. I'm setting a stop loss of 20 points in the DAX. The simple reason for this is that I don't have any reference values up here. To the downside, I actually want to get back below the liquidity from this morning specifically into this free session impulse that we saw here.
Yes.
Just to take another look down there and see what's going on. That's the point. I have several thoughts behind this. One of them is for example, that I assume real liquidity from the big players will only return to the markets on Monday and I just see a very high lack of liquidity right now. I'd also like to show you a bit of this here when I analyze what I'm looking at. On one hand I have the footprint charts here where you can see that a lot was simply absorbed up here and already here as well. And that there is definitely a possibility here, first down here, then also to return to these price areas and then see whether the market triggers a reaction down there. Because all of this is definitely not healthy. From the volume profiles, we are of course above the previous day. That means it's a very risky trade and you shouldn't expect it to fall incredibly deep now either. But you can clearly say that the profiles themselves are all balance heavy. That means there's not much power left in them. And for me that is always a very clear first sign that the global markets are finally starting to go there and are beginning to actively exchange significant amounts of money. Yes, let's take part in this exchange process and simply approach it in such a way that we say here is an opportunity for a consolidation of this exaggeration. For now, you can see that beautifully here as well. There was absolutely no liquidity here. The first liquidity we have is in the 21, 24 area. And if I now see that the market really starts to sell aggressively, am I also willing to open another position? I always say at least now we have one foot in the door, which of course always comes with risks up here. But I can see that, for example, we now have a nice step here where the market is running back into, let's call it the small liquidity of the current session. And at the top, you can simply see that nothing was happening anymore. And we also had a finished auction. That means the market formed a completed auction at the top. If I look at the American futures as a counterpart, I also see that there is much, much less action there. And that's also something that simply tells me, yes, it's definitely within the realm of possibility that we could see a nice consolidation here. For now, in terms of risk reward ratio, we're currently at about 1 to 6. That's obviously very, very high. And yes, trades like that are of course, really fantastic. And now you can already see it really well here. I also want to sketch it out for you here so you can get a bit more understanding of it. So what you can see here first, and for me, this is always actually the most important indication is my risk. This is my opportunity. Now, of course, if you take your profits early, if you take your gains beforehand, then that's obviously not a good risk reward ratio. That means you need to know your hit rate with such counter trades. And it should definitely be in the range of 40 to 45%, especially if you're working with a risk reward ratio where you start taking profits somewhere around here. But in any case, we want to see this impulsive candle traded below because I noticed that there was no real liquidity present here. And that means for me that the market participants were under pressure. And by pressure I mean they had to buy proactively right at the market open. And those are always special situations that I really, really like. I can also show you that here in the footprint chart. You can see it very clearly here. Here you can see it at the market open this morning. Very little liquidity down here. That means there was an I have to buy sentiment in the market. So they had to go long and up here. The following has now formed. You can see that very, very clearly. There was a big seller here and here. There were several large parties who were willing to swap their positions. From a small picture perspective, it's very Often the case that we first move back into these volume areas and see how the market behaves there. But nonetheless, the alpha idea which you should always keep in mind for yourself is simply this one here. In my opinion, the market open was too extreme and above all it wasn't accompanied by real volume, but rather there was an I have to push sentiment. That's why I'm quite happy with this position for now and will wait because the market will show me the rest. So, and now you can already see that more selling is happening in the market here. Even though, for example, the NASDAQ is staying relatively stable right now, that doesn't matter because you can see it very clearly again that the discrepancy between Europe and the American futures in the pre session, there's not that much going on. So now you can see it very clearly right now we have a risk reward ratio of one to one, which means we've now basically achieved the profit stretch that we had previously defined for ourselves on the loss side. And of course it is important to note that that's really nothing particularly special at first glance, especially when you consider a hit rate of only around 45% or perhaps 50% at the very most, then you're just at break even. If I now go further and say I have a hit rate for such trade, for example, 60 or 70%, then the whole story looks completely different. I'll show you this math again in the coming weeks. And now it's simply a matter of waiting patiently. The rest is up to the market. And yes, we can sit back and just let the trading happen. Here you can see it very clearly. We are below this stronger selling step, which you can also see very well here in the order book via the volume profile. And as long as we stay below here and selling keeps coming in from above, everything is fine for now. Now a seller has to come in.
Did you see?
Right now the seller came in exactly on cue. Bang. That's exactly what I want to see. Then I'm satisfied and I don't worry about anything. Trailing the stop loss is something a lot of people like to do. In this case I don't do that because I just see that the overall position with a risk reward ratio of about 6:1 is simply so good that I don't worry about it. Instead I do the following and this might be interesting for some of you to see as well. If we now see the area around 13 again right here and here, and see the sellers show up, yes, then I'm definitely willing to increase the position once more with this, I now also have my total loss of about $1,000. And I continue to handle the situation by saying, yes, there needs to be pressure up here now, because if there is not and if there is no lack of liquidity at the top, then.
I will get stopped out.
And that's part of it too. And that's not a problem. You can see it really nicely here. There's a fight going on here in.
The area of 16, 17, 14.
And what I can see very clearly is this. At the moment, the seller has the upper hand. Yes, he's more aggressive. He's firing his sell orders right into the limit orders down here. And I can well imagine that we're about to see a reaction at the half hour close. So let's take a look at this together on my platforms that I use for analyzing and viewing the volumes. And you can see it really well here. Now that we're staying exactly where the prices have established themselves, that means there are actually traders there who are interested in exchanging their positions. Just as I always say, where liquidity is being played, the market is imbalance. And as long as it keeps moving back and forth within this equilibrium range, it's very, very important to avoid just one thing as much possible. Though of course I have no control over it. That is that suddenly aggressive buying happens up here in the market. And I haven't seen that so far. That's why I'm quite satisfied with my positioning right now and will continue to wait here patiently. I can also see here that there is nice selling going on. I can also see it here in the delta that in these last two candles we had a selling surplus. That also makes me confident that the market currently has more selling pressure. These are the cumulative buy and sell orders for the corresponding price range. And now it's a matter of waiting. In the meantime, I'm going to quickly go get myself a coffee. So yeah, this doesn't look too good for me right now. Not so great. But that's part of it too. I'm stubbornly sticking to my stop loss. And if I get stopped out in a moment, that's just part of the game, then I would look for another position. If necessary. I would look for one. If I saw again that the market is giving up its liquidity there. Now we're also making new highs and that's always very, very exciting. But the market up here isn't really taking off yet. Now we've been stopped out and that's just part of it. So I can definitely see that there's still no liquidity being played up here. And now I am actually going to proceed with entering another trading position. I'm giving the market an initial stop of $500 again. For now, I still have the idea that we should come down here. I'm watching this very closely now and I see it up here, but that we have a finished auction again and also no more liquidity. That means we're definitely in a very, very turbulent situation. And I can also see now that the market isn't being absorbed intensively up.
Here.
It'S being heavily sold. I want to show you this again here as well. So especially with such counter trades, if you realize that your basic idea wasn't correct, but you just got stopped out, you can definitely do this. Then you can definitely enter the position again here. Look here you can see the large volumes. They've been traded over again now, but there's just no real liquidity coming in anymore.
Coming in.
You can especially see that up here beautifully in the order book. There's nothing left. And what we have here now is a great example for the PBD logic. I want to show you that that will also motivate me in a moment to increase the position if that's the case. Now here we have our range from our P, that's our P. And if I now see that we actually break out of this range to the downside, then I would definitely look for another position down here. Then I'm quite confident that the market will wipe out the whole thing to the downside. You never know in advance, but it's definitely worth considering. Anyone who wants to play it safe with such counter trades logically has to wait until this, let's call it bullish zone here, where you can also clearly see the liquidity gets traded through. And only then does it make sense to look for a trade. Of course then you have a higher hit rate, no question about it. But in terms of risk reward ratio, in the current situation as we have it now, you're definitely not in. I'm someone who likes that, but only when the market shows me very specific situations, just like it is right now. We can also clearly see here that the market is actually starting to accumulate again in this upper price range. And right here it's also forming an inside bar that's always a sign of waiting of balance. And as I said, I can also draw this in here so we know exactly what we're talking about, which definitely needs to be traded below. So what is this price Range now and everything above that is of course risky and also requires an incredible amount of experience to actually take such trades in the end. We will now see very clearly at this point Here at this 320 level whether the market finds buyers there again. And then of course that's bad for us because it could mean that this structure continues. If I now had liquidity above, I'll show you that briefly as well.
So if I had a lot of liquidity up here right now above this price range which I'm marking here on the top right in this five minute chart, and, and if the market were to accumulate large volumes there, then yes, I would definitely be looking for a long position.
But why am I not looking for it?
Because the initial balance is so large, meaning the expansion of the trading opening is just very, very big. And that means here traders had to buy at the market open. At that point they don't really care what the price is because these are hedging transactions and they will certainly be corrected later. And now it's a matter of waiting. There's nothing more we can do. Yes, I can already see it now. There's active selling going on again right now. So up here the orders are being routed much more aggressively on the sell side than on the buy side. That's a good sign for me. And now of course it's about observing what happens here in this price range. This is exactly the price range around 320, 323. And what I'd really like to see now is the market being sold off aggressively. If liquidity starts to dry up there again, that means no one's interested anymore, then things get tight. But if liquidity increases again, as we've.
Seen up here.
So here in this price range, then we know exactly it's accepting prices down there again, it likes it, it's waiting for supp and demand to simply be present. And then we can assume that if it drops below this price range, we could see some movement in the dollar first. But as I said, we're not there yet. We just have to wait and see. Now this right here is the line that's decisive for me. And yes, everything above it is of course extremely strong. Even though there's no liquidity at the moment. Here too you can see again that nothing is really happening up there anymore. No one's having any fun up there. And that's quite interesting. Gold futures are also being steadily sold off right now. You can see that quite clearly as well down here there's a weak low. Yes, that means there's now also a likelihood that gold futures will dip a bit further. So now it gets interesting. We're now exactly in this price range around 320 and coming right back to this liquidity. And now I'm watching to see how the market behaves here. And look, you can see it here. There's a bit of absorption happening here as well. And I'll show you that now in the smaller chart. So you get an idea of what's interesting to me right now. I've drawn the line here.
317, 318, 319.
As I said, we're in the DAX future, so you can't go down to a single tick. But look, liquidity is being played down here again and the liquidity is being played within the larger liquidity. And of course, I like that. That's nice. And now the question is whether we here also drop below this range. And let's take a look at the whole thing together on the chart, because here the market has just pushed down a bit and as long as we stay below 336 to 340, everything is actually cool right here. Exactly. Yes. Now some small buyers are coming in again, but it's nothing major because the market has just completed down there. So and now it's wonderful to see again how aggressively it's being sold off there. And that's exactly the real art to observe such structures and not to jump back into the market long too early, especially when you don't actually have any information for it from above. So let's let the market play out a bit and then we'll see later how the whole story continues, because right now it's just a matter of waiting. Now it's wonderful to see how the market has reacted up here again and how liquidity is being sold off up here again. So for me, the following needs to be done. Now I'm opening another position and I don't want to take on too much risk. That's why my stop loss is now set exactly above the last volume levels. And if we push above here again, then it's over anyway. And now I simply have a great chance that the market down here will generate a wonderful trade for me. So once again, it's a matter of waiting. In any case, for me, one thing was important and right. The market showed me that there is rejection up here. And the market also showed me that the speed with which it rejected this is promising for me. Plus, as we saw earlier, there was liquidity down Here, that means the market likes the liquidity down there. And now we wait. The rest is up to the market. So now we're entering the exciting price range where we simply have to see to what extent the outcome will be decided by the reaction. And that's exactly what you can see here now. A significant amount of liquidity is being sold again and that's exactly what we need now. We're happy. And if you now leave this block below 304 down here with liquidity, then our trade is a great trade and will bring us a lot of joy and it was worth it to make a re entry here. So now you can see beautifully how the market always moves from block to block. Yes, now we're coming back to the lower edge here. The best thing that could happen to us right now is exactly this, that the market continues to provide liquidity on the sell side and ideally it also maintains its speed. If it doesn't do that, then as we can see right now, there's a bit of absorption down here again. But you can definitely see here, just look at the contract sizes, the seller is the bigger one and that's exactly what is effective for us. And now it's time to take another risk. Yes, as we can see, the market is dithering again. And that's actually a good sign because the longer a market takes and the longer it aggregates liquidity in this price range, the stronger the next subsequent trend will be. It is quite a bit like a physical rubber band that you keep on stretching further and further apart and then when you let it go, it suddenly snaps back. So entire situation could get quite interesting right now. And then we have this low volume node here. Let me pull that up for you again. So right here, yes, this price range with no trading activity and then the next stop for us is this price range, 285. Like that, 85, 83, where we can see if there will be a reaction.
And then if we want, we could.
Potentially take our first profits there. I'll decide that when the market gets there. So, and that's really the whole story, what trading is always about. How high is your risk? How great is your opportunity? In this case, for example, roughly a little more than 2 to 1. And now comes the crucial part. How high does your hit rate need to be in order to make money with this? And that's what I want to explain and show you. So, and that's actually the essence of trading. Look, if you have a risk reward ratio of one, that would mean that the winning Streak and the losing streak are each the same. So 20 to 20 points, 50 to 50 points, it doesn't matter. Then you need a hit rate of 50% just to break even. But if you now, as I just mentioned, have a hit rate somewhere in the range of 40 to 45% with such counter trigger trading strategies, then you need at least a risk reward ratio of 1.5. But that demonstrates quite clearly that I'm already generating consistent profits with a risk reward ratio of 2 or even significantly greater than 2. And my equity curve will definitely consistently maintain an upward trajectory over a large number of trades, simply because I have an intelligent risk reward ratio actively working in my favor over the long term. Looking at the situation for us, what that specifically means is we're here, let's do the math. Going from 85 down to 30, that means we have 55 points remaining right here. Moving upwards, we have the range from 35 to 50, so 15 points, That means for us, crystal clear, we have a risk reward ratio. 55 divided by 15. Is equal to 3.66. This is therefore a great risk reward ratio for this trade. And that's exactly what we need in order to earn a lot of money sustainably, mathematically speaking. If you want, I'd be happy to do an extra session on this just like this video and say it's really exciting. So, and here we can also see this right now. The market has now shown us below the balance that it wants to stay there for now. And now we're coming exactly to that price range where in the end we have our first target zone that's just also below this low here and below this low here. Yes, we already have a gigantic trade and now I'm very curious to see what happens when we get into the 86, 84 range. Yes, let's give the market some time and watch what happens. So now we're taking apart out here and yes, nothing can really go wrong anymore. I'm very, very happy with the trade. So, dear friends, let's take a look at what has become of the trade, how things are currently developing, and it's actually very, very exciting to look at it now. You can see the following here. Really. Well, the market has really sold off now, just as we had hoped. And now it gets interesting because now we have a new balance here. That means the market has a new price range that it considers fair. And this price range is now crucial for us. Whether it picks up momentum from there and says, I accept everything to the downside, then it could really go lower or whether it moves back above it. And those of you who know the PBD logic know that it's time at the latest after a retrace to get out of the whole thing. Therefore, from now on it's simply effective to definitely place the stop loss here and then wait to see whether the market continues to give us gifts or not. So in plain terms, we can't lose any more now and the rest is.
Up to the market.
Now we'll wait and see what the momentum is like if it drops below 265, meaning 25,265. And then we can also decide whether to take partial profits or not. We'll see then. Yes, here you can take another great look at it. If you view it from a profile perspective, you can see it nicely here. We have a very large initial balance, which means right at the start start at the start of trading, the market was in a major imbalance and currently the value area is up here, meaning today's equilibrium is up here. But now we've seen that there was quite a bit of selling up there as well. And that's why I'm confident that something could happen there again. And we use that for ourselves, for example, to see if there is a reaction here at yesterday's value high or if we re enter the range, whether the market finds acceptance there. And then I would also exit the corresponding trade. So this looks great for us because this is exactly where I want to go, as I mentioned earlier, first into this area and then to see if we can find a suitable trade. Take profits again again here.
I will now watch how the market.
Is behaving right now since I'm trading discretionarily today. Take a look here. It's wonderful to see here there's liquidity at 250. Such a nice round number. The market will surely go for it. And then let us observe what happens in the area below that. Traded right into it nicely. That means the qualifier down here is relatively large. You can see it clearly. So that means we'll probably see a short pullback here first. Now it looks like the market is still searching for liquidity down here. You can also clearly see the volume step between this upper area and the one below it. What's always interesting underneath that is whether the market speed will catch up. And that's exactly where I want to look. Now what's interesting for me is what happens here. Will there be absorption here or will the market keep pushing through? I can already see it. The market speed is decreasing. And for me, that's always a sign to take a closer look here as well. Nine contracts. Eight contracts. That's also the value area high from yesterday's range. So I'm taking some profit here and.
Then I'm done there.
Very nice. So I've had a really great trading day today and can just let the rest of the position run for the day whether it hits or not. So my stop loss for the remaining position, I've now adjusted it to the 310 area. That means I'm just going to let it run now and end this trail. I'm very satisfied with that. And yes, that's something I can definitely pass on to you. Even if you take a few stops, that's absolutely no problem. That's part of trading. It's normal. Especially when you're acting as a counter trader at such highs. It happens again and again. And I hope you especially understood the math behind it once again and what my approach is like. I think that was very valuable for some of you. Thank you very much for listening. Leave me a like if you enjoyed it. See you in a few days. Bye everyone.









