DAX Hits ALL-TIME HIGH! Is the CRASH Coming Next?
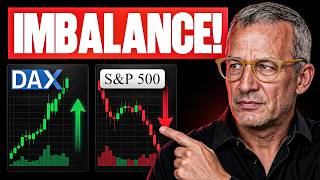
Tom Voelwald spots a divergence: Bitcoin, Nikkei, and S&P 500 all falling while DAX futures hit an all-time high in two days. He reads this as a liquidity imbalance and sets up a short trade at 690 using his P-PD framework, with stops and two profit targets.
Chapters
Correlation, or when things go differently in the markets, when some imbalances prevail that suddenly show you something is just not right. And that's exactly what we've seen in recent days, especially in the DAX future. And now the big question we must always ask is, is the DAX future really significantly stronger than the American and the Asian markets? Or is there some underlying factor present that leads to a market imbalance, an imbalance, or perhaps an urgent need to buy? And exactly when such situations occur, that's when I love to trade. I call this strategy "When Things Go Differently," and I'll show you today how we can plan exactly this path for ourselves and when the right time is to invest. So stay tuned. I'm Tom Voelwald. I'm the Tradermacher. I've produced many great traders, such as Patrick Nell, Fabio Valentini, Christoph Radeker, Andrea Simitan, just a few of them, and many more. But one thing I can say, this can change your perspective on not entering the market too early, and that's exactly what I'll show you today.
Correlation is when markets usually behave the same way, but suddenly one market, for example, takes a completely different direction. And I want to show you something about that because it's always super, super exciting when we have such opportunities. Let's look at Bitcoin first. As you might know, my logic and analogy is that when Bitcoin starts to weaken, then it's definitely a bit of a risk-off. That means liquidity is being pulled out of the markets, and as a result, the markets simply go down a bit. But let's look further. Here we have the Nikkei. And the Nikkei, as many might know, is the largest Asian index. And you can also see here, in the last 5 days, it went really nicely. Downhill. So we remember, Nikkei down, Bitcoin down. Now let's look at the next chart. This is specifically the Standard Poor's 500, and the S&P has also been following a downward path during these last 2 days. Up here we had a nice support. We already discussed that last week. That means the Nikkei is also on its way down right now. Everything's relaxed. It's not about having extreme short moves here or anything like that. It's just about checking what the distribution is like right now. Let's go to the next market. And that's exactly what was exciting, namely the DAX. And the DAX index had a massive and very significant increase during these two specific days. This means the DAX rose extremely sharply even though the Nikkei, Bitcoin, and the S&P were simultaneously following this specific path right here at the same time. And for me, that is a very clear and distinct form of a market anomaly. Now you can think about whether stocks are particularly strong right now or if there's a relocation. All of that is possible. But I'll give you a deeper insight now into what it's really about in the end, in my opinion. Look here. And this is the weekly profile of the DAX future. And only the first day. And you can see here, this is an increase— well, let's say it's already very extreme. Right at the very beginning of the market opening, we saw the price action move down briefly before it started to stabilize and subsequently established what we call 1, 2, 3, and 4 distinct so-called single print areas on the chart. That means very aggressive buying by market participants, and something like that is always an imbalance. Now here on the right side, you can see the exact same information recorded during the live cash session. That means this is the market phase where the highest liquidity is present between 8:30, 9 o'clock, and 17:35, where the cash times of the DAX future are simply present, where the stocks are predominantly bought. And you can also see there, it was bought maximally aggressively. The market was up here and then it continued on. The event continued, and as we speak, we're moving on to the events of day 2. Because remember, that was day 1. Yeah, you can see it here too. A very, very aggressive rise. Here is the value area. That means the equilibrium part, as I've explained in many other videos. And now the market has shown me something quite remarkable. At yesterday's initial market open, it started way down here and then suddenly shot up just like a powerful rocket. And in a moment exactly like this one, I know for sure that there is a very high probability the market will eventually correct itself. Why? Imagine you're a large institutional player wanting to move a lot of money into the market. You need balance. Why? So that you have the opportunity to enter your positions calmly. And especially at the market open, many participants want to enter their positions. But if the market suddenly spikes upward like this right at the open, you'll never be able to get the fair market prices you deserve. This means a move like this is always caused by a major imbalance, usually by option traders finding themselves in significant trouble or futures traders hedging their bets. And that is always an excellent opportunity for us to see if we can find a potentially profitable trading idea for a short position right here. And I would like to show you now exactly what I traded there yesterday. Now let's take a closer look at this from the specific PPD concept. Right here we can clearly see this particular move, observing how the market ran up and everyone created a solid balance. It had already shown me a very nice inside bar right here, and that is exactly what prompted me to take action. So, to put it simply, I want to enter a short position right here. Plus, we are currently trading well above those old highs, which essentially formed a ledge, a weak high from small traders, and we just catapulted right past it. And that is always a specific moment where I say to myself, yep, now the time has come for me to start looking for short opportunities. And anyone who knows the PBD concepts knows that a P is usually something that strategically leads to a trend continuation. And now I'm saying I'm looking for a short up here. Very simple matter. You can only do that when the market tells you no more liquidity is coming up here and the main liquidity is moving lower, and ideally below this. So what we know now is if it goes from the liquidity below, that will take out the entire distance below the start of the impulse. And that is exactly what happened. But how can you trade something like that? And that is perhaps much more exciting. And we can already see here, this is where I opened the position. As you can see, 690 was my entry level. 184 is Take Profit 2. Take Profit 1 is this price range. How did I get to this price range? Well, if we look closely, it is essentially starting from this P right here at the upper edge. And in this area, I am definitely expecting a reaction at first. But that is still almost 260 points, and compared to my current stop loss, that is very reasonable and manageable. Now, of course, there is always the possibility that the market will move against me and take me out of the position once again. And let's take a look at that together. Now, here we can see that everything looks like sunshine and rainbows. I really hit the top right here. I could show you all of this in great detail using the footprint chart. But we'll keep it brief today. And that's how it looked. I felt good, but I left my stop loss up here. Please remember the weekly profiles, and then you'll immediately understand why that's the case. Because up here, above this, the market would have run into an absolute imbalance, and it probably would have continued to climb at an explosive rate because more hedging opportunities would have arisen. How did the entire situation continue? And we always have to be honest with each other because I had already entered the market right here. And as you can see, the market went above this again. And then I got lucky, yeah, because it didn't hit my stop loss, which was up here. It didn't break it. If it had been hit, then I would have just been out of luck, but that wouldn't have been a big deal either. But what we have now, and this is just really That is quite interesting. It is a P pattern formation with a so-called fake breakout and a renewed acceptance of this balance. And now you can see clearly, if we look closely, right here would have been a much more optimal entry point, and it would have been a bit safer for the trade. But I didn't get that because I wanted to be in. And then looking closely at the chart, you can clearly see exactly what the market did next. In the end, it beautifully and consistently continued to play its established range right here, and it gave us a perfect opportunity to open a new position again via a standard pullback if that had indeed been a viable option for us at that time. As you can clearly see right now, yes, I've moved the stop loss up because we are seeing market acceptance, and we're over here. And for the people who say, for example, I'd rather enter via a pullback once the market has shown me it's really time, Yes, you could have also entered here and then already adjusted the stop loss to this point. That would have been another option. I chose the option to let it run, take out one position here, and the rest stays in. And I'll let it run until it either reaches the target or— now with a new stop loss, once it moved to $650, I won't lose any more money. And that's the whole story. I really like trading these types of market setups. Specifically, when I see a clear imbalance in the markets, then I basically look for a P-formation that's slowly exhausting itself. And when I see the available liquidity decreasing up here, and maybe even another fake move like this one up here, it shows me quite clearly that the price is going down now. Yeah, then the time has simply come when you can make a really big trade and you feel very comfortable and safe with this trade, because, you know, especially if you know DAX future, it's a market when it starts to rumble slowly and the guys don't buy in anymore because they don't have to anymore, and those who think it's still going further long, who keep pushing in, then it's a joy, because then suddenly the movements against the trend go incredibly fast, and you have such opportunities to achieve great profits for yourself I hope you enjoyed that. I hope this helps you move forward. That was from my side for now, a wonderful way to show you how I deal with imbalances and correlations. And yeah, always look at how Bitcoin is doing, how Nikkei is doing, how America is doing, and how Europe is doing. And if you see that something is very non-uniform, then you can trade the strongest market in the opposite direction, or even the weakest market. But always look if there is a differentiated story. Because if, for example, fundamental news had led to one market being extremely strong and the other not, then that's a different story. In this sense, bye everyone and see you very soon.









