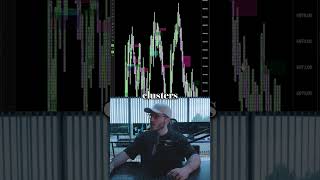
The Deep Print indicator shows buy and sell order imbalances inside candlesticks. Purple numbers signal aggressive selling controlled by smart money, often acting as support or resistance that drives whole-day price moves. The Imbalance Tracker automatically plots these clusters to spot early movement zones.
Chapters
If you click new and chart, you get your good old boring candlesticks. But if you go on indicators and you search for deep print and you zoom in inside of the candles, you will see all the buy and sell orders that enter the market. The real supply and demand. And when the numbers are colored in purple, this is what we call a order flow imbalance, where there was much more aggressive selling than aggressive buying and sellers were in control of the auction. So this was smart money. And you'll see that these areas very often gets respected and actually leads the movements of entire days. And if you're lazy and you don't want to zoom all the way in, you can simply add the imbalance tracker, which will automatically track clusters of imbalances and automatically plot these on your chart. And especially when they are at the beginning of the movements, you'll see a lot of reactions in these areas. Like look at this one, for example. There's four imbalances in one candle, and that's exactly where buyers in the following candle gets completely obliterated. Or also on this candle where there was a huge buyer over here that moved price, there was literally no following candle that was able to close below this area because this big buyer is protecting his position. But these are professional trading charts and they're typically very complicated to understand. But with deep charts, we've made them very, very intuitive. So follow to see more charts like these.