GEX is a Trader's Most Powerful Tool | How Gamma Exposure Predicts SPX Moves | AND HOW TO TRADE IT
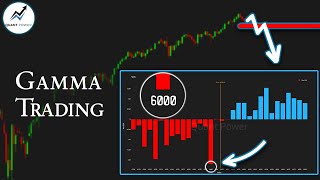
Kardec Trader explains how Gamma Exposure (GEX) reveals intraday support and resistance levels that predict SPX moves, using zero-DTE options flow to guide trades like bear call spreads. Recent case studies show GEX pinpointing levels like 6590-6600 support and 6650 resistance. The presenter warns that SPX concentration in the Big Five stocks increases fragility and a 6-10% correction is possible if key supports break.
Chapters
In this video we will analyze the prospects of the stock market and I will tell you about a trading strategy that will make your trading much more profitable. But let's take things one step at a time. At the beginning of this week, the SPX hit a new all time high. However, a decline began shortly after. This raises questions. Has the bull market ended? And most importantly, what should we focus on now when making trading decisions? In this video I explained in great detail that since 2022 the factors influencing the stock market's movements have changed. The main drivers now are liquidity and the actions of market makers. This is precisely why the market is ignoring macroeconomic indicators, most of which signal an economic slowdown as well as numerous other historical correlations that previously led to declines. The answer lies in this chart. It shows that the volume of zero day to expiration options trading is now approaching 60%. In other words, 60% of the options bought today will be closed today. For comparison, just five years ago this figure did not exceed 15%. The key point is that such a high volume of zero DTE options directly impacts the positioning of dealers and market makers and since they are the primary providers of liquidity, their actions will directly influence how the market moves. Today, the only tool that can provide a clear understanding of how market makers will move the market and what they will do is the Gamma exposure profile. In my previous video I showed in great detail that thanks to the extremely high accuracy of the signals sent by the gamma exposure profile, we can very clearly identify key levels and forecast the direction of movement. I also gave you several examples where I showed that even in a rising market one can earn good money by opening a bear call spread from a resistance level which is essentially analogous to a short position. And before we move on to discussing the overall market situation, lets look at a few more examples of how to open trades using the Gamma exposure profile. Last Thursday, the day after the Fed lowered the rate, the market opened with a gap up and during the first hour the SPX showed upward momentum. From the perspective of classical technical analysis, there were no reference points. The market had just hit a new all time high and above the price. There were no visible levels or even a trend line that we could perceive as resistance or a growth target. However, if we open our application, the link is in the description below this video and look at the gamma exposure profile. The situation was extremely clear. Moving from bottom to top, we see that the key support level was located in the 6590-6600 range. These are the largest absolute gamma values and the gamma flip zone was also located there. The gamma flip is the level where gamma transitions from positive to negative values and it will always act as either strong support or strong resistance if it is above the price. The nearest resistance level was at the 6650 mark. These are the largest positive gamma values as well as large absolute gamma values. We also see that even larger values were present at the 6700 level. This level could also be designated as resistance, but that day, since it was very far away and had the significant 6650 resistance in its path, the price was unlikely to reach it. For better clarity, we can plot all these levels on a classic price chart. Since we understand that the price has almost no chance of rising to 6700, we ignore that level. The 6650 level has large positive gamma values. On the chart this is marked with a green line labeled P1. Also at 6650 there were the second largest absolute gamma values on the chart. This is marked with a purple dashed line and labeled AG2. Additionally, this level had the maximum call option volumes, so we designate it as Resistance 1. At the 6600 level we find the largest absolute gamma values on the chart. This will be the purple dashed line labeled ag. This level also had the maximum put option volumes and at the 6590 level there were the largest negative gamma values which are marked on the chart with a red line labeled N1. This level was additionally strengthened by the gamma flip. After we plot everything, we can see a very clear picture of where the price is relative to the key levels. Also on the main page of our website, at the very bottom there is a chart like this one which shows dynamic support and resistance levels. First let me answer the question of why these levels are dynamic. The fact is they can change their location during the day. This is explained by the fact that data is updated and changes throughout the day. And if the algorithm concludes that a resistance level needs to be reconfigured, it will be reconfigured. In other words, if for example, at the beginning of the day a resistance level is here, the price tests it and starts to fall. And if at this point the algorithm determines that the price should under no circumstances bounce back up, then this resistance level may be reconfigured lower and it will be assumed that the price will now not break through this range. The the main advantage of this chart is that if these levels coincide with the levels on the gamma exposure profile that we have already identified, this signal is reinforced for us and we understand that in this example it would be an excellent place to open a bear call spread. Here we see that the resistance zone coincides with the level we identified earlier on this chart. Also, a post was published in our community emphasizing that 6650 to 6660 was the key resistance level. And if you watched the previous video, you already understood that it was the perfect place to set up a bear call spread. In the end, the day closed below the resistance level and the bear call spread yielded the maximum profit. By using only the gamma exposure profile and the chart of dynamic support and resistance levels, traders can already perfectly assess the market situation and create an action plan in advance. The entire philosophy of our website is built on the idea that market analysis should take no more than a few minutes, be as visual and understandable as possible. We immediately see all the important levels and understand how and in which direction the price should move. However, this application also allows you to track market anomalies and moreover, warns you when it's not worth entering a trade. An example of such a day was Friday, September 19th. If we look at the gamma exposure profile from that day, it looked like this. Let's plot all the key levels we could identify. We could highlight the 6650 level as the nearest strong resistance. This is a significant spike in positive gamma as well as the largest absolute gamma values. At the 6620 mark was the gamma flip zone, and slightly lower at 6,610 were the largest negative gamma values. We could designate this range as support. But since the price was near the resistance level at that time, our primary interest should have been what to do with this resistance level. This level also coincided with the resistance range on this chart, which further strengthened it. We can see that right at the beginning of the day it already caused a downward reaction, but the price approached the resistance level again. Under normal circumstances, this would have been an excellent place to open, for example, a bear call spread. However, at that moment, the following post was published in our community. In yesterday's commentary, we discussed that the largest options expiration in history is taking place at the end of this week, which could add an element of intrigue to the market. Nevertheless, yesterday gamma exposure showed a clear picture and the only key resistance level visible from the very beginning of the day ultimately held Today the picture is more blurred. The 6650 level is the nearest strong resistance. This is a major spike in positive gamma as well as the largest absolute gamma values. This level triggered a downward reaction from the very start of the trading session. However, it is noteworthy that the quant power line has been sitting exactly at this level since the beginning of the day. Thus, we have a level that acts both as resistance and as a target for price movement. This is why, after a downward correction, we see the price reversing upward. Although the price is once again approaching the resistance level, I am not opening any positions right now as the price is also precisely at the quant power line. Opening speculative short positions such as a bear call spread or an iron butterfly targeting the quant power line would make sense only if the price reaches higher resistance levels 6670 to 6680. However, there is not much time left. Let me remind you that the quant power line and the power zone indicator are the most powerful tools in our application. The power zone shows two main the range and the peak values. When we talk about the range, we need to visually identify the square with the largest values. Most of the time, the price will tend to trade within these boundaries. If it happens that the price moves outside this range and for example, approaches a resistance level, that is a signal for us to consider opening a trade in the opposite direction. Anticipating that the price will return inside the square, the peak values of the power zone will coincide with the quant power line. This line acts as a compass determining the price movement. If you are hearing about this for the first time, I recommend watching these videos where you will find answers to all your questions. Since on that day the resistance level coincided with the quant power line, opening short positions from there made no sense. This could have been considered if the price had risen to the next higher resistance level while the quant power line remained below. But as mentioned in the post, there wasn't much time for such a maneuver to play out. Secondly, it was a major expiration day and the market movement could have been somewhat illogical. Since there were no clear signals for either long or short trades, it was better to avoid trading that day. Yes, friends, even though gamma levels give us a very clear understanding of what's happening in the market, it doesn't mean we must open positions every minute, every hour, or even every day. I often say that sometimes I might do nothing right now, but I know what I will do if the price reaches my desired levels. This philosophy is confirmed by the post written that day. Ultimately, the day closed near the upper boundary of the resistance level. The price didn't drop. But most importantly, we understood perfectly well why that was a possibility and did not open any positions. Let's look at another interesting example. This is the gamma exposure profile from Monday, September 22. The market opened at the gamma flip level which was the nearest and key support. The closest resistance level was at the 6,675 mark, which had fairly large positive gamma values and also saw the highest call option volumes. The main resistance level was at 6,700, featuring the largest positive gamma and the largest absolute gamma values. Since the gamma flip always carries significant importance, we see that from the very start of the trading session, this level acted as support and pushed the price upward. But when the price approached the first resistance level, something interesting happened. In this screenshot, the white chart is Apple stock and the blue chart is Nvidia. At this point the SPX reached the Resistance one zone and let me read you a fragment from the post published in our community. While Amazon, Microsoft and Google were correcting today, Apple provided support to the market in the first half of the day. This allowed the spx to reach resistance 1. However, just as Apple finished its rally, news broke literally a few minutes later. OpenAI and Nvidia enter partnership Nvidia to deploy 10 gigawatt systems and is ready to invest up to $100 billion in OpenAI. This caused Nvidia to take the initiative and the market was pushed even higher. An ideal scenario would be for the market to approach 6700. If the price manages to reach 6700, we will see a significant deviation from the peak of the power zone. Therefore, at that level I will consider opening a bear call spread. The only question is whether the market has enough strength and time to grow a bit more as the deviation is already quite substantial. Even though the market showed an upward move today, I ignored long positions because the upward thrust we are currently seeing is merely a reaction to timely news. As a result, the price managed to reach the Resistance 2 zone and the bear call spread opened from this level yielded a 100% profit by the end of the trading session. I want to particularly emphasize that last week's Thursday and Friday as well as this week's Monday were days of heightened uncertainty. First the reaction to the interest rate decision, then the largest expiration, and on Monday the reaction to the timely news release, which, however it may sound, was issued to push the market a little further. Nevertheless, even on such difficult days, thanks to the gamma exposure profile, we not only clearly understood what was happening in the market, but also knew when, under what circumstances and from which levels we could open positions and when it was better to refrain from trading. With the arrival of Tuesday, the situation Began to clarify and trading became easier. This is what the gamma exposure profile looked like on Tuesday, September 23rd. The day opened at 6690, right within the gamma flip range. This zone by itself was perceived as the strongest resistance. But slightly higher at the 6700 level was the largest absolute gamma spike. This further reinforced the zone as resistance and we immediately understood that the day would clearly not be on the bull side. As a downside target, we could identify the 6650 level. This is the largest negative gamma and the second most significant absolute gamma. If we look at this chart, even at the very beginning of the trading session, it showed a key resistance level around 6700 and a support level at 6650. Seeing such clarity in the levels, the entire market analysis and movement forecast would take no more than two minutes. One could confidently open short positions from the resistance level, anticipating a price drop to the support zone. I also want to remind you of a very important point. Positive and negative gamma are not just red and blue bars. They are an indicator of how the market maker will act when the price is in the territory of positive Gamma. In other words, when it is surrounded by blue bars below and above, it means the market maker will act as a market stabilizer and will reduce volatility. I mean, when approaching support levels, for instance a gamma flip zone, the market maker will buy when approaching resistance levels. For example, the largest values of absolute or positive gamma. If they are above the price, the market maker will close positions. Therefore, in positive gamma territory, when approaching a resistance level, I recommend betting primarily not on the price falling sharply from that level, but on the level not being broken to the upside. At first glance, it might seem that there's almost no difference since in both cases we don't expect the price to rise above resistance. But the fundamental difference lies in the strategies. For example, when opening a bear call spread from a resistance level in positive gamma territory, it won't matter to us at all how deep the price falls or if it falls at all. The main thing is that it doesn't go above the breakeven point. And in such a scenario, the position will yield the maximum profit of 100%. Naturally, since a bear call spread is a credit strategy, we will earn less on it compared to using a directional strategy. However, in positive gamma territory, it will be much more justified and safer. When the price is in negative gamma territory, the market maker will act in the diametrically opposite way. They will sell into a falling market and buy on bounces from support levels. This will lead to increased volatility and market movements will be quite fast and impulsive on that day. Tuesday, September 23rd. Even at the very beginning of the trading session, understanding that the price would not overcome the resistance zone and that it could switch to negative gamma territory any minute, one could open a directional short targeting the 6650 level. In the end, if we look at how the day ended, the movement played out perfectly. The price moved from one level to the other and during the downward movement, the price encountered no obstacles. Let's quickly look at another example. This is the gamma exposure profile. On Wednesday, a couple of minutes after the trading session started, the spx was around 6670. The gamma flip zone was also passing through here, meaning that if the price dropped below 6,665, the downward movement would accelerate. An additional resistance is the 6690 level. This is where the largest positive gamma values are located. If we look at this chart, we can see that the day has just begun and only the first candle has appeared. Here we see that the algorithm calculates a resistance level around 6,690, above which the price is unlikely to go, and a support level around 6620. However, since the price is in the gamma flip zone, I would also take this level into account, which runs approximately like this. It immediately becomes clear that the day will belong to the bears. This is evident even from the number of resistance levels above the price. This gives rise to a very simple trading idea. One could consider short positions here, with the nearest target being the support level around 6620. As a result, in less than three hours the price reached this level. Thus, thanks to the gamma exposure profile, we not only see all the key levels in advance, but we also understand their relative importance and have a clear idea of how the price will move. If you want to always be one step ahead, the link to the website and community is in the description of this video. In conclusion, let's briefly discuss the overall market situation and medium term prospects. As the SPX set an absolute all time high on Monday, a new record was also set. The share of the five largest companies now accounts for about 30% of the index's weight. These companies are Nvidia, Microsoft, Apple, Alphabet and Amazon. Such capital monopolization is a natural feature of developed capitalism. Larger companies absorb more and more smaller ones, leading to capital concentration in a narrower segment. However, this creates an extremely fragile structure. A narrow market driven by a handful of stocks becomes highly vulnerable. Furthermore, this situation undermines the very purpose of portfolio diversification. If the lion's share of the market is tied to a few companies, then if they begin to correct, other stocks will not be able to hold up the market and will follow suit. The current situation creates a unique macroeconomic dissonance. Classic leading economic indicators such as job openings data, have long been signaling a slowdown. These indicators are merely a precursor of upcoming economic difficulties. Historically, markets began to decline at the moment the trend of key indicators such as the unemployment rate broke and the reaction was almost instantaneous. However, in this cycle the SPX continues to rise. This contradiction can be explained by one key factor. The leading companies belong to the lagging economy sector, primarily services and technology. They are the last to feel the effects of a general slowdown. Thus, the peak of the index in this cycle may occur not before, but after the onset of a downturn in the general economy, breaking familiar historical patterns an additional catalyst for the growth of the Big Five has been AI. This superimpulse has allowed tech giants to ignore broader market trends, but its effect cannot last forever. From a technical standpoint, the index's rally shows signs of exhaustion. The slope of the upward trend is slowing, which often precedes a reversal. A key support level lies near current prices. A break below it would be a serious signal for the start of a deeper correction. It is worth noting the ongoing negative divergence between the SPX and the rsi, which also favors the bears. Speaking of Moving averages, the 50 day ma is a key support level as market makers place their stop losses along it. This moving average is currently sitting right on the lower trend line of the ascending channel. On the 15 minute timeframe, the key support is at 6600 to 6620. On Monday I shared this screenshot in our community. It shows that while the price had a chance to climb towards 6700, the most significant level was 6620. By the end of Wednesday, the price had already tested this level and now all attention is focused on it. This is because a price drop below this level will allow us to more quickly pinpoint the trend reversal moment. One should also not forget that historically September and October are the weakest months for the stock market. It is premature to talk about the emergence of a full fledged bear market. For that we would need to see more confirming signals in the form of breaks below key support levels. However, it is quite likely that we will see a downward movement developing from October to November with a potential decline of 6 to 10%. Bitcoin. The chart clearly shows an uptrend originating from the lows around $15,000. The price has repeatedly bounced off this trend line, confirming its strength. The current support area is in the $102,000 zone. For investors, this level serves as a guide for risk management. For long term holders who bought at lower levels, a reasonable strategy is to place a stop loss order below this support. This allows locking in profits in case of a reversal. For those considering new purchases near all time highs, the current zone presents elevated risk. The bearish scenario is the priority. If sellers gain control and the price decisively breaks the support level, it would be a strong bearish signal that could trigger a deep correction. Technical analysis suggests a potential target for such a move around $30,000 corresponding to the historical depth of corrections of 70 to 90% from the previous rally. Accounting for the expanding base. Formally, a price drop below the trendline support followed by a retest of it as resistance would confirm the formation of a head and shoulders pattern. Despite Bitcoin showing readiness for a downward reversal, this is not a call to short it immediately. It is a warning that buying now is dangerous. And if you are already in long positions, it makes sense to tighten your stop loss on lower timeframes. The price structure appears complete and shows signs of buyer exhaustion. A bearish ending diagonal pattern has formed a breakout of which often precedes a correction. Bitcoin is in a zone of high volatility and uncertainty. The long term trend remains bullish, but short term and medium term risks have increased significantly. Investors should focus on risk management via stop loss orders. Traders should wait for a clear break of the key level $102,000 followed by a retest before considering short positions. Premature shorting at historical highs is an extremely risky strategy in the world of finance. There are indicators that not only show the dynamics of a specific asset, but also reveal deeper systemic processes. The US Dollar Japanese yen pair is precisely such a marker. It serves as an accurate barometer of global liquidity and risk appetite. For many year, the Japanese yen has been a classic asset for the carry trade strategy. The essence is that investors borrow funds in a currency with a low interest rate, in this case the yen, and convert them into higher yielding asset stocks and bonds of other countries. Decades of near zero interest rates from the bank of Japan created an entire ecosystem. Major banks, hedge funds and financial institutions massively used cheap yen to finance investments worldwide. Thus, the yen became one of the key sources of liquidity for global financial markets, especially stock markets. The situation changes drastically when the yen begins to strengthen and Japanese interest Rates rise. This forces players who previously borrowed yen to hastily close their positions. The process looks like this. Losses on the currency pair force investors to sell the assets they bought with borrowed funds, US Stocks, European stocks and so on. They then convert the resulting dollars or euros back into yen to repay the loan. This leads to cascading sell offs in stock markets and a sharp contraction in liquidity. A vivid example of such carry trade capitulation were the events of August 2024 and the spring of 2025 when the yen strengthening coincided with a sharp 20% drop in the SPX. Currently, the US dollar to Japanese yen pair is in a state of uncertainty, showing consolidation in the form of sideways movement or even forming a triangle pattern. The key support level to watch closely is at the current local lows. As long as this level holds, the situation remains in question. This is also indicated by the horizontal position of the 200 period moving average. A decisive break below this level would be a serious bearish signal. It would mean the establishment of a series of lower lows and lower highs, confirming a trend change to downward and paving the way for further yen strengthening. The chart also shows the potential formation of a large reversal head and shoulders pattern, a break of whose neckline would be an extremely powerful signal for a decline. US dollar to Japanese yen is not just a currency pair for speculation. It is a strategic indicator for the entire global financial system. A rise in the pair supports risk appetite and liquidity, while decline is a harbinger of tightening financial conditions and a potential large scale sell off in asset markets. A fundamental factor strengthening the yen is Japan's strategic goal to return its key interest rate to 2%. This is further supported by the fact that inflation in Japan is currently higher than in the United States and the European Union. That's all for today. Happy trading and see you next time.









