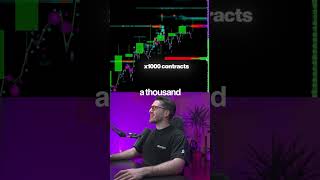
Liquidity heatmaps show where large institutional orders sit, letting traders set targets with better risk-to-reward ratios, sometimes 1:4 instead of 1:2. A 1,000-contract buy order from a major bank can push price for an entire session. Price gets attracted to these liquidity zones then rejected by them, a pattern candlestick wicks alone won't reveal.
Chapters
Without a heatmap, you're going to place your target under the nearest low thinking that that's liquidity. But you could have done up to a 1:4 with a heatmap that shows you where liquidity actually was. So instead of taking target here, you can take target here. That's literally double the risk to reward. And if you're in, in longs, you're going to target the most recent high and think this is a liquidity grab. And the exact same candle with the heatmap you could see that a huge buyer placed 1,000 buying contracts right over here. 1,000 contracts is not a retail. It's probably a big bank institution or a huge trader. And right after that big order is placed, price keeps moving up and up and up for the entire session. With price, you cannot know this is gonna be the high because we're literally at all-time highs. But with liquidity heatmaps, you can see that exactly the same wick That's where we had the biggest liquidity area of that level, and that's exactly where price stopped. And all of the most important highs and the most important lows will tend to happen around these liquidity areas. So price will be attracted by these areas and then rejected by these areas, especially when big buyers suddenly appear to support price. And with Candlestick, you are blind to all of this. So comment liquidity to get your hands on this type of software as well.