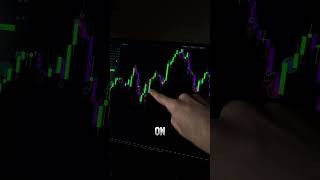
A short YouTube segment by Kardec Trader outlining three progressive levels of candlestick charts for professional day trading: (1) standard candlestick charts across timeframes, (2) candlestick charts augmented with large/institutional trades to follow "smart money," and (3) pure order-flow charts showing market-wide buy/sell dominance and liquidity areas. The creator offers a free guide via their YouTube channel.
Chapters
If you want to make serious money professionally day trading and not being a degenerate financial gambler of the digital space, there is three levels of candlestick charts that you need to know. Level one is normal candlestick chart. This is the basic price going up, price going down in every single time frame. Level two is the candlestick charts with big trades on top. These are basically trades made by institutional traders, bank hedge funds and algorithms that you can use to follow where the smart money is going with the chart. Level three you have pure order flow charts. This basically shows you the entirety of the market's order flow. Who's buying, who's selling, who's dominating the market and you can know it before any price action trader can realize. And the final level is to go from this type of chart to this type of chart where it shows you the liquidity areas where people are placing their buy and sell orders and how the market is interacting with them. On my YouTube channel I have a free guide on how to use these. Comment Order flow and I'll send it over.