How Gamma Exposure Works - Advanced Option Strategies
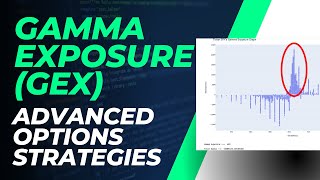
Kardec Trader breaks down gamma exposure and how option dealers hedge by buying or selling the underlying, which can push prices in the short term. SPY shows concentration zones around 418-420 and 403-405 where gamma effects cluster. A trade idea from April 30 profited from selling pressure near one of these zones.
Questions this video answers
April 30 (Sunday).
Approximately 418–420 (selling zone) and roughly 403–405 (buying/neutral area).
Hey everyone, I wanted to do a quick overview on what is gamma exposure and how can you use Gamma to identify major levels of supply and demand. You can see here we've got a few different zones identified and if you watch our previous videos, you see us reference this many times. And basically what we're doing is we're taking data from the options market and we're identifying areas where major market participants are positioned. And so we use this Gamma data in our trading strategy. And so I just thought it would be appropriate just to kind of show you guys our conceptual framework for using this data. So what is Gamma? Gamma is actually a second order derivative. It's one of the option Greeks. And it basically is measuring the level of acceleration of an options price based on the change in the underlying stock. So if you're familiar with options at all, you've probably heard of option delta. Delta is measuring the change in the option price based on the change in the underlying stock price. Well, Gamma is measuring the acceleration of, of that change in the options price based on the change in the underlying stock price. So I know it sounds a little confusing, but basically option prices don't move in a straight line. There's a certain convexity into the way option prices move. And you can see here on this graph as we get closer to the at the money level on an option price, whether we're coming from in the money or whether we're coming from out of the money, there's a convex nature here on both of these slopes. And that's what Gamma is measuring. That's what gamma exposure is measuring. And so because of the convexity in option prices, option dealers and big institutions, basically anybody who manages a large options portfolio, they have to hedge their gamut exposure because that's where price movement is going to hurt their positions the most. So option dealers and major market participants basically are hedging their options exposure by buying or selling the underlying security. So depending on how they're positioned, whether they're long calls, short calls, long puts, short puts, they're basically going to be either buying or selling, selling the underlying stock in order to hedge their position, their options position. So all of this hedging activity that's taking place is basically responsible for a lot of short term directional moves in the underlying stock. So that's why it's important to identify these gamma exposure zones. So we know where our major market participants positioned. Once we know that, we can identify strategies around those positions because we know, you know, most likely what's going to happen at this Level is dealers are going to be selling. Most likely what's going to happen at this level is dealers are going to be buying. So here's our gamma exposure graph. We produce this data on a daily basis, and these levels basically are telling us where the major levels of concentration are. So this is, for example, this is for the spy. We can see here the biggest concentrations are at 404 20. So we kind of know like that's where the most market participants are positioned. So in the case that price moves up into one of these levels, there's going to be a certain reaction. And so we need to be able to interpret what are market participants doing at these levels. And there's several different ways we can do that. One way is by measuring the total gamma. If total gamma is positive, that means there's a kind of volatility compression because market participants, in order to hedge their positions, are having to sell when price goes higher and buy when price goes lower. So it kind of compresses the price action. If, for example, this total gamma was negative, then what that would mean is that participants, and especially option dealers, would have to sell as price goes down. So it's kind of like this negative feedback loop. If price was going higher and total gamma was negative, that would mean that option dealers and major market participants who are managing option portfolios would have to continue buying in order to hedge their position. So again, that's a positive feedback loop. So depending on what total gamma is, is it positive, is it negative, how positive it, how negative is it? Those factors will determine how prices are going to move when you come into these big concentration levels. Another factor that determines price action when you're moving into these levels is our market participants repositioning. So you can see here, we've got this huge concentration at the 420 level. But that doesn't mean that it's static and it's always going to be there. What could happen is as price moves into the 420 level, as we get up to 415, for example, market participants could reposition and, you know, maybe the 425 or the 430 level starts growing. Like, let's say we wake up tomorrow and the 4:30 level has tripled. And we see this huge concentration here. What does that mean? Market participants have repositioned and they are starting to move with an expectation that prices are going to go higher. So having that information, knowing how market participants are positioning themselves by seeing what is happening on the gamma exposure data, that can tell us a lot about what is going to happen when we get into these big concentrations here. And again, what this is doing is it's basically telling us where market participants are positioned. Where are the biggest concentrations? You can see here we identified on this chart there was a big concentration zone between 418 and 420 on spy down here, there was a big concentration zone between 405, kind of like the 403, 405 range. And zero gamma represents the neutral level. It's where participants are neither bullish nor bearish. They're kind of like neutrally positioned. And so because we did not see further concentrations above 420, we didn't see anything growing at 425 or 430, really. So we said most likely this means that option dealers and other big participants in the market are going to be sellers. If price comes into this zone, it doesn't mean that price is for sure going to like, you know, fall off a cliff down here, but it just means there's going to be selling pressure. And just look at how price action played out. It got into right into like this kind of selling zone. And the pressure was too intense and obviously it sold right back down to the neutral level, bounced and then fell again to the neutral level. And then sellers, you know, there just were no buyers here, so kept falling down. But there are buyers sitting in this level, which we identified way back here. So these zones are important. They're basically telling you where participants are positioned and what's likely going to be happening at those levels. And so when you're thinking about gamma exposure, you kind of have to think in like a three dimensional framework, right? It's not just very simple like oh, 400, you know, you should buy, oh, 420, you should sell. That could be the case. But there's many other factors that you have to consider. You have to consider what is total gamut? Is it negative? Is it positive? How negative is it? How positive is it? What else is happening here in the market? Are participants repositioning at the 430 level? For example? Are participants repositioning negative down here at the 390 level? Is that concentration growing? Is the concentration growing up here? So there's many factors that can affect price action based on the gamut exposure. But having this data is super important. And this data is, you know, it's basically constantly updating on a daily basis. And so, you know, knowing what's happening at these levels, knowing it's kind of basically helping you visualize where participants are positioned and how are they moving their positions across the market? To be a successful options trader, it's all about managing your probabilities and hedging your risks. Same thing as if you're an equities trader, except with options, you actually have the mathematical data because options are a mathematically based derivative. So you can actually calculate the data of your probabilities and you can determine probabilistic path outcomes based on this data. That's what we're trying to do here with a gamma exposure and trying to interpret what market participants are doing at each of these levels. So this was actually a trade idea that we posted on our Trade Ideas dashboard back on April 30th, which was Sunday. So, you know, we knew we were getting close to the selling zone and it was actually looking like a really great trade setup. So we thought, hey, if we come in Monday or Tuesday and you know, the spy continues trading up here close to the selling zone, this would be a really high probability trade to put on for a move back down into either the 0 gamma level or the buying level down here. It doesn't guarantee that that's going to happen. It just is telling us again that dealers and participants, we're likely going to be selling here, especially because we didn't see any buyers coming in above this level. So we knew there was going to be some selling pressure here. And we can take a trade that has a really great risk reward setup for our portfolio. And so we see here how this played out. Sellers came in and it did come right back into this zero gamma level. So if you guys are interested in learning more about how this works, we have a free newsletter you can sign up for. We also have access to our Trade Ideas Dashboard for our premium members. So if you're interested in either of those, I'll put a link down in the description below. Also, we just launched a Geeks of Finance community Discord. So if you guys are interested in checking that out, I'll also put a link down in the description below. It's going to be a free trial for seven days. There's an invite link also in the description below. So come on into our Discord, say hi and check us out. I hope you guys were able to find value in this video. If you have questions, you know, I may have glossed over a few things. If you guys have any questions, you know, hit me up in the comments section below and I'll try to answer those. But I really hope this is kind of giving you a better understanding of our approach to Gamma exposure and to using this data that is provided to us through the options market. Thanks so much for watching, everybody. I'll see you guys in the next video.









