How GEX Predicts ALL SPX Moves AND HOW TO TRADE IT | Gamma Exposure is the Most Powerful Tool
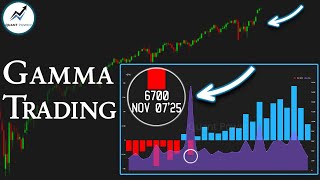
Kardec Trader shows how gamma exposure and dealer positioning, driven by a surge in 0DTE options now 60% of daily volume, have become the primary driver of SPX moves since 2022. He uses GEX heatmaps to identify intraday levels and trades them with spreads like bear calls and iron condors, expecting faster moves in negative GEX zones.
Chapters
Two weeks ago, on Friday, October 10th, the stock market crashed after Trump escalated the trade war with China and promised to impose 100% tariffs on all Chinese imports starting November 1st. However, this weekend, news emerged that China and the US reached a certain consensus during trade and economic negotiations in Malaysia, and now the tariffs will not be implemented. The stock market reacted very positively to this and the SPX gapped up strongly on Monday's open this situation is catching many investors off guard. On one hand, it creates the impression that the market is driven by news which is impossible to predict before it is released. On the other hand, it feels like the market has completely detached from any fundamental and macroeconomic indicators. Every day we see one classic indicator or another which shows how expensive the market is setting new all time highs. Even the great traders who tried to logically explain why investing in the market over the past two years was very dangerous ultimately turned out to be wrong. For example, since Michael Burry published his famous post advising everyone to sell, the SPX has risen by 65%. This leads many traders to ask what should they now base their trading decisions on? And is it even possible to predict the market's movement? In previous videos I have already explained in detail that since 2022 the factors influencing the movement of the stock market have changed. The main drivers now are liquidity and the actions of market makers. This is why the market has long ignored the slowdown in macroeconomic indicators, the QT program, high interest rates, as well as many other historical correlations such as the inversion of the yield curve between 10 year and 2 year bonds. The answer to why none of the negative signals have so far broken the market lies in this chart. It shows that the volume of zero day to expiration options trading is now approaching 60%. In other words, 60% of the options purchased today will be closed today. For comparison, just five years ago this figure did not exceed 15%. The point is that such a volume of zero day to expiration options directly affects the positioning of dealers and market makers. And since they are the main providers of liquidity, their actions will directly influence how the market moves. And today, the only tool that can provide a clear understanding of how market makers will move the market and what they will do is the Gamma Exposure profile. In my last video, I explained in great detail how, using this profile, one could have predicted the market drop that happened on Friday, October 10th as early as Monday, October 6th. Today I will show you a few more examples of how this works and how to profit from it in our app. The link to which is in the description below this video. Let's open the gamma exposure profile for the SPX for Monday, October 20, about 40 minutes after the trading session began. It looked like this. We can immediately identify all the key levels. The 6740 to 6750 range we mark as resistance. This area had the largest values of absolute and positive gamma. The nearest support was at the 6700 level. This was the second most significant absolute gamma value and around 6650 to 6655 there was a gamma flip zone, which traditionally always holds high significance for beginners. Let me explain that. A gamma flip zone is where gamma values transition from positive to negative. Since this level was below the price that day, it was also perceived as support. Now let's also look at the chart of dynamic support and resistance levels which are calculated automatically by our algorithm. We can see that the algorithm's readings do not contradict this assessment. With the resistance zone around 6750 and the support zone around 6650. That day, a post was made in our closed community stating that the price was trading between the resistance and support levels and that the priority was to consider countertrend positions from the resistance level. I don't think I need to explain that a countertrend strategy from a resistance level means that when the price reaches it, one can open a position equivalent to a short trade. I want to remind you of a very important thing. Positive and negative gamma are not just red and blue bars. They are an indicator of how the market maker will act when the price is in the territory of positive gamma. In other words, when it is surrounded by blue bars below and above, it means that the market maker will act as a market stabilizer and will reduce volatility. What I mean is, when approaching support levels, for example the gamma flip zone, the market maker will buy. When approaching resistance levels, for example the largest absolute or positive gamma values, if they are above the price, the market maker will close positions. Therefore, in positive gamma territory. When approaching a resistance level, I recommend primarily betting not on the price potentially falling sharply from this level, but betting that this level will not be broken to the upside, for example by opening a bear call spread. In this case, it won't matter to us at all how far the price falls or if it falls at all. The main thing is that it does not go above the breakeven point and in this scenario the position will bring the maximum profit of 100%. Naturally, since a bear call spread is a credit strategy, we will earn less on it than by building a directional strategy. However, in positive gamma territory it will be much more justified and safer. When the price is in negative gamma territory, the market maker will act in the diametrically opposite way. He will sell into a falling market and buy on bounces from support levels. This will lead to increased volatility and market movements will be quite fast and impulsive. In this instance, on Monday, October 20, the price was trading within positive gamma territory. Therefore, when approaching the resistance level, the correct approach was to open a bear call spread, primarily betting that this level would not be broken to the upside. When the price approached the 6750 resistance level. Another post was published stating that based on the power zone distribution, SPX has no particular reason to move above 6750 today. You can see here that above this level the power zone values decreased significantly. By the way, if this is your first time hearing about this indicator, be sure to check out the playlist dedicated to this topic. You'll find answers to all your questions there. For example, when discussing the quant power line, I've already explained that it serves as a pointer for the direction the price is likely to move. This line aligns with the highest power zone values. When we look at the power zone, we should visually identify the square containing the largest concentrations of values. This square represents the range where the price will tend to gravitate and where it will trade most of the time. If the price happens to move outside this range and reaches a resistance or support level, that becomes an ideal place to open a position in the direction of the highest power zone values. As I mentioned above, the quant power line aligns with the peak power zone values. This is intentional. The quant power line serves as a guide for the price's projected movement. However, sometimes during the trading day, the quant power line can change its position. Meanwhile, the power zone values update with every page refresh. Therefore, if you refresh the page and see in real time that other power zone values are starting to increase, you will know in advance where the quant power line is likely to shift. But returning to Monday, October 20, I also wrote in the post that I had opened a diagonal call spread expiring on Friday, October 24th. It was a neutral position with a slight bias to the downside. The idea was that if the upward movement continued for a while longer, the position wouldn't spring any surprises given that its upper break even point was above the current price. On the other hand, if the market moved down with increasing volatility Within a few days, it could be closed before expiration. In the end, on Monday, the price failed to break through the resistance level by the close. Consequently, a bear call spread with zero days to expiration opened from that level would have yielded the maximum profit. On Tuesday, October 21, even before the market opened, the gamma exposure profile looked like this. The 6800 level immediately stood out as it showed the largest values of positive and absolute gamma. The nearest support level was around 6730. This was a gamma flip zone in the community. I commented on this situation as the 6800 level has the largest positive and absolute gamma values. Typically, such strong levels should be viewed as a magnet, a place the price will gravitate towards. However, today there are several nuances that cast doubt on the likelihood of such a movement. First, these values are located above the all time highs which themselves act as resistance. Second, there are algorithmically calculated resistance levels below 6,800 which will pose an additional obstacle to such an upward move. And third, it coincided with a resistance level on spi. Today I prefer to avoid looking for long entry points. The priority is to consider entry points either from the resistance level or if the gamma flip zone is broken, to expect a more substantial decline. In the end, the day was very boring. The price spent the entire day battering against the algorithmically calculated resistance level but was unable to break below the gamma flip zone. On TradingView, I marked these key levels like this and here you can see that my resistance zone is slightly wider. What I mean is if according to the algorithms it was around 6,750 to 6,760, mine extends up to 6,770. The thing is, that day, the 6,770 level coincided with an important 675 level on spy. On Wednesday, October 22, things got more interesting even before the market opened. During the pre market session, the gamma exposure profile looked like this. The price was near the gamma flip zone which was the nearest support. Below that, the 6700 level stood out as it had the largest values of absolute and negative gamma. Also of note, the quant power line was at the 6700 level which further increased the probability of a downward move. For better visualization, let's transfer all these levels to the TradingView chart. Moving from top to bottom, the 6780 to 6800 range is marked as the resistance zone. This area contains the largest positive gamma values and also shows the peak call option volumes. The gamma flip zone is positioned at the 6730 level. This area also held the second most significant absolute gamma values. The most critical level was 6700. This level had the largest negative gamma values, the highest put option volumes, and also the peak absolute gamma values. To remind you, the larger the absolute gamma, the greater the magnetic properties the level possesses. Additionally, the quant power line was positioned at the 6700 level, providing another argument in favor of expecting a downward movement. In my commentary, I wrote that I would refrain from looking for long entry points. My priority was to consider entries either from resistance levels or in the event of a breakdown below the gamma flip to expect a more substantial decline. The market opened slightly above the gamma flip, tested it as support, and about 15 minutes after the open I wrote again that despite this always being strong support, I'm not considering long positions right now. If price breaks below the G flip, I'll open a broken wing, Put butterfly on spx expiring on October 31st. Literally just 20 minutes after that post, the price broke down through this support and since it moved into negative gamma territory, the downward movement began to accelerate and at one point the price even dropped to the 6650 level. What was interesting, however, was that the entire time the quant power line remained at the 6700 level and by the end of the day the price had returned precisely to that level. Thursday, October 23rd was a truly interesting day. The market opened around the 6700 level, right where it had closed on Wednesday. By that time, the diagonal call spread opened on Monday was showing a profit of over 100%. Let me remind you that in the post on Monday I wrote that if the market declined within a few days, the position could be closed before expiration. But let's get back to Thursday and see what was so interesting about it. The 6700 level was a gamma flip zone and also had the largest absolute gamma values. This level was the main nearest support. Below one could also identify 6,675 and even 6,640 as potential support levels. But as long as the 6,700 level wasn't broken to the downside, it was premature to discuss them. We simply marked them on our charts to have a reference for where the price could go under certain circumstances. As for resistance, we identified the 6750 mark. This was the largest nearby positive gamma value, the second largest absolute gamma value, and it also coincided with the peak volume for call options. If we transfer all these levels to TradingView, they looked like this 6750 is the main resistance. Labeled as Resistance 1, 6700 is the main support. And a little over two hours after the market opened, the price was stuck right in the middle between these two levels. What I mean is, at the start of the day, the gamma flip level, reinforced by the absolute gamma, caused a bounce upward, but the movement seemed to stall. Let's discuss how one could have acted in this situation. First of all, at that specific moment, the best decision was not to open any trades. There were several reasons for this. The first reason was that the power zone was at 6750. This was an argument in favor of the market potentially rising to this level. In other words, if we look at the screenshot, we can see that the largest power zone values which coincide with the quant power line are at the 6750 level. Since the power zone values decreased above this level, it made no sense for the price to rise above it that day. So the power zone indicated a growth target towards 6750. But this same level was also acting as resistance. A question might arise. Why not open a long position? Then? This leads to the second reason. The absolute gamma was positioned completely on the opposite side at the 6700 level. It's not that these values must coincide, it's just that both currently carry significant weight, but are positioned diametrically opposite. I'm trying to say that if, for example, the maximum power zone value is here, and the largest absolute gamma values were located, say here or here, then that would indeed be a strong argument for growth, because the key levels would be in the same territory. In this case, however, it turned out to be an impromptu tug of war. The third argument which prevented opening a directional trade directly from the current levels was that if you look at the chart on the key levels page, the price was essentially in the middle between two equally significant levels. However, more important indicators were concentrated at the 6700 level. Also, if you look at the chart on the open interest volume page, the main parameters also show that the price was between two very powerful levels. And as a bonus, all of this was reinforced by the levels calculated by the algorithms, which were positioned exactly in the same areas. Thus, the argument in favor of growth was the power zone, while the significance of the 6700 level argued for it acting as an anchor. In such a situation, the best course of action is to wait for the price to approach the resistance level and only then open a countertrend strategy from that level. In the end, the peak power zone values and consequently the Quant power line won out and pulled the price towards them. It is a very powerful tool that genuinely influences price movement. It's just that on that particular day there were certain doubts about whether it would be strong enough to drag the price higher. But that is absolutely normal because it's crucial to always assess the situation comprehensively rather than relying on a single indicator. On the other hand, even though it was better not to make any decisions while the price was stuck between the levels, one could have taken action once it approached the resistance level. The price reached the resistance zone approximately two and a half hours before the end of the trading session, which was more than enough time to open. For example, a bear call spread. By the end of the trading session, the price had not broken above the resistance level and if you had held the position until expiration, you would have achieved a 100% profit. The entire philosophy of our website is built on the idea that analyzing the market situation should take no more than a few minutes and be as visual and understandable as possible. You immediately see all the important levels and understand how and in which direction the price should move. Even in situations like the one above, where the probabilities of the market rising or falling are almost equal and we can't make a trading decision at that specific moment, we still understand why it's happening. We see the levels in advance and know what to do if the price reaches them. If you want to stay a step ahead like this, access to the website and community is in the description of this video. On Friday I didn't follow the market closely and frankly there wasn't much interesting happening. An hour before the trading session began, slightly cooler than expected inflation data was released. Market participants interpreted this information optimistically and the market opened with a gap up from the very start of the day. The resistance zone was around 6,800 and the quant power line was also there all day. In the end, the entire day was traded in a very narrow range around this resistance zone, which by the end of the day still had not been broken to the upside. In conclusion, let's discuss the overall market situation. Undoubtedly, the most notable recent event was the weekend news that China and the US reached a certain consensus during trade and economic talks in Malaysia, meaning tariffs will now be avoided. The stock market reacted very positively to this, with the SPX gapping up strongly on Monday's open. From a technical analysis perspective, the price broke through the upper boundary of the long term ascending channel. The market is technically very overbought right now, but after such impulsive breakouts the price typically doesn't reverse on the same day and tends to trade at new highs for some time. If we look at the gamma exposure profile on Monday, two hours after the market opened, the price was surrounded by positive gamma on all sides. This picture is typical for days like this because investors become filled with optimism as breaking resistance levels and achieving new all time highs is a very bullish signal. Given that the price was surrounded by positive gamma, a trader shouldn't even consider opening short positions. The main resistance level was at the 6875 mark. This represented the largest positive gamma values, the largest absolute gamma values, and this level was further reinforced by peak call option volumes. This level also coincided with the resistance zone calculated by the algorithms. However, given the concentration of significant values at this level, it served not only as resistance but also as a target for the price to gravitate towards. Ultimately, by the end of the trading session, the price approached exactly this level. On Tuesday, October 28, the gamma exposure profile displayed one of the simplest patterns. I explained it in detail in this video. Its essence is that when we see levels with similarly sized positive and negative gamma values reinforced by large absolute gamma values, it means the market maker will try to keep the price within this range for as long as possible. In 9 out of 10 cases, the price will not break beyond its boundaries by the end of the day. The simplest decision one can make when such a pattern appears is to open an iron condor right at the start of the trading session, shifting the breakeven points just five points above and below the support and resistance levels. Two hours after the trading session began, the quant power line is positioned at the 6900 level, indicating that some modest upward movement during the day is still expected. Looking at the algorithmically calculated levels, 6840 is the support zone and the resistance zone is at the 6905 level. As a result, the price reached the resistance zone, but by the end of the day it remained within the range boundaries and the iron condor yielded the maximum profit. I'm recording this video on Wednesday, 30 minutes after the market opened and today's gamma exposure profile looks like this. The largest positive gamma values are at the 6915 to 6925 levels. The largest negative gamma values are positioned at the 6850 mark. The largest absolute gamma values are also at 6850. Although noticeable clusters appear at the peak positive gamma levels. If we look at the algorithmically calculated support and resistance levels, resistance is at 6970 and support is at 6840. The range is very wide. However, the Fed will announce its interest rate decision today, an event typically accompanied by elevated volatility. Now, for clarity, let's transfer all these levels to TradingView. The 6925 level contains the largest positive gamma values and the second most significant absolute gamma values. Since there's nothing visually significant above this level, we mark it as Resistance 1. At the 6971 level, we plot Resistance 2, which we take from the algorithmic calculations. The nearest support lies in the 6860 to 6850 range. This is the gamma flip level and it's also where the largest negative gamma values, absolute gamma values and peak put option volumes are located in close proximity. Since the price is currently near the resistance zone, one could place a bet on a market decline through day trading. However, given that the price is in positive gamma territory, it's better to open a bear call spread here rather than taking an aggressive short position. Also, it's important not to forget that today, due to the interest rate decision, there's a risk of heightened volatility. Therefore, it's better to close intraday trades once they become profitable and not wait for expiration. In this example, if you open a bear call spread from the resistance level, you could close the position when it reaches a profit of 30 to 50%. Such profit would be achieved if the price falls just 15 to 20 points. The market is severely overbought right now. That's a fact. Opening large long positions at these levels, hoping that a correction will never happen again, is fundamentally wrong. Just remember what happened with gold over the past few weeks. The higher it climbed, the longer the cues to buy it became worldwide. At that point, one of the most powerful divergences in observed history formed between gold and global liquidity. Given that these assets have a correlation of around 90%, this divergence was anomalous. Yet it didn't deter people. In the end, gold fell over 10% in just a few days. A somewhat similar situation is now unfolding in the stock market. The trading at all time highs and the higher it goes, the more faith we see that the rally will continue. On the other hand, opening an aggressive short position when there are no signals for it is also incorrect. In such a situation, one of the right approaches is to open a neutral strategy with a slight bearish bias. For example, you could open a diagonal or a calendar spread expiring on November 7. The idea is that if even a minimal market correction occurs within the next few days, this position could be closed for a profit without waiting for expiration. At the same time, if the market continues its slight upward trend, these positions won't bring any unexpected surprises this week. When making trading decisions, it's important to consider that the Fed will announce its interest rate decision on Wednesday and several major tech giants will report their earnings in the next couple of days. That's all for now. Good luck with your trading and see you in the next videos.









