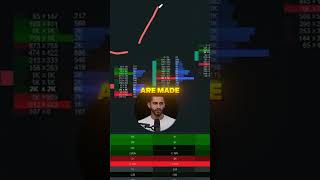
Kardec Trader breaks down how to read footprint charts: watch order-flow deltas in five-minute blocks for stagnation, spot passive sellers at key levels, and find unfinished auctions where highs or lows show a zero, signaling one side is exhausted.
Chapters
One thing that's happening with the orders, the delta for these kind of five minute blocks are staying stagnant. Most of the aggressive buying, or if any aggressive buying is happening on the upper side as it's happening on the upper side. What I see as a trader most of the time is I see passive sellers being active, that there's limit orders hitting these levels. That's number one. Number two, another thing I look at as we're going into key levels is I look for something called unfinished auctions. So anytime there's a high or a low made in the, in the movement, right, I look at those levels where the highs and lows are made and I identify if there is any sort of unfinished auction. So an unfinished auction looks something like this. This is what I want to see as a trader. Not this, not this. If we hit a high, I want to see a zero on one side at least. Just, just as basic knowledge, right? Because that implies that, you know, traders are in here, traders in here, they're aggressively hitting the ask and there's no orders on the other end. Auction is wiped out, auction is finished.