How to Find Supply & Demand Zones using Gamma Exposure | lesson #3
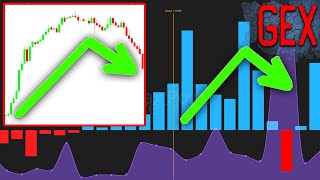
Kardec Trader shows how to use gamma exposure profiles to spot intraday supply and demand zones. Gamma peaks act as resistance or support, and levels can pull price like magnets. Use these signals to build option strategies like bear call spreads, betting that price won't breach key levels.
Chapters
With these videos you will learn to understand the gamma exposure profile, learn how to build gamma levels, what signals they send us, understand what primarily affects price movement and learn how to make money from it. In previous videos we have reviewed the signal that will indicate that you can safely take a long or short position. We have learned to identify a signal that will indicate that it is possible to open a long position to break through the resistance level and a short position to break through the support level. In the same video we will look at the signals for a market reversal. That is, these are situations in which it will be possible to open a short from the resistance level and along from the support level. Well, let's go straight to specific examples because it will be clearer this way. On January 22nd, two and a half hours after the market opened, the gamma exposure profile looked like this. The price was around 6,100 points and we can see that there was a major surge in positive gamma at this level. There were also large absolute gamma values. And we already understood that this level was a powerful resistance because there was no point in rising above 6100 on this day because the gamma exposure value drops sharply above this level and there was nothing interesting for the price. There were only two main scenarios. Either the 6100 level will act as a magnet due to the size of gamma exposure and will not let go of the price during the day and the day will close approximately in this range either. There was a second option that this level would act as resistance and send the price down to the level of 6075 because the second highest value of absolute and positive gamma was there. But in any case, the main idea was that the 6100 level was a resistance and should not be broken up. In this situation, a bear call spread strategy would be a good fit. The position profile will look like this. So just in case, we shifted the self payoff point slightly above the resistance level and if the day closed slightly above the resistance level, we would make a profit. If the day closed at the resistance level, we would also make a profit. And if the price fell, we would also make money on it. If you look at the price chart with all the levels plotted, it looked like this at that time. And if you look at the results of the closing of the trading session in more detail then. Indeed, after the Test of the 6100 level, the price turned around and the day closed with a drop. Another example is February 12, three hours after the market opened, the price reached the level of 6060 points. If you look at the gamma exposure profile, it looked like this. We see that the price is near the gamma flip zone. In previous issues, I have already said that this zone will always be either a powerful resistance or a powerful support. Since the gamma flip was just above the price at the moment, it acted precisely as a resistance. We also see that negative gamma outperforms positive and absolute gamma prevails in the territory of negative values, which further increases the likelihood that the resistance level will not be broken. Plus, we see that large negative and absolute gamma values are located at the level of 6050, which are larger than any positive gamma values. Taking into account all these factors, we could conclude that the level of 6065 to 6070 would not be broken. It would act as resistance and the day would close somewhere near the maximum values of negative gamma. In this situation, we could also open a bear call spread, which is exactly what we did in our community. As a result, if we look at how the day closed, the price could not break through the level of 6065 points. From this level, it went down and the day closed at exactly 6050, that is at the level of the maximum values of negative and absolute gamma. Another example is February 4th. If we look at the gamma exposure profile an hour after the market opened, we see that the price was around 6030 points. And there were three powerful positive gamma spikes slightly above it, up to 6040, a little higher. At the 6050 strike, there was another Gamma island, which acted as the last frontier. But in general, given that gamma exposure was falling very much behind these three pillars, we understood that this level was a powerful resistance and the price would not go above it that day. But given the strength of this level, it will also act as a magnet at the end of the day, and the day will have to close. Somewhere here on the chart, all these levels looked like this. And you can see how much the range of 6030 to 6040 points stood out. If we look at how the day ended up, we can see that 6040 was a resistance. During the day, the price went into a downward correction from this level. But the day closed at this level as expected. What could we do in this situation? Well, since 6035 to 6040 was a powerful resistance, it is logical that from this level it was possible to bet on a decline. And here I want to tell you a very important point. Just mark it for yourself. In the world of options, and especially in intraday trading, a bet on a market decline from the resistance level should first of all be perceived not as a bet on a fall, but as a bet that the price will not go above the resistance level. Betting on an upward rebound from the support level should first of all be perceived not as a bet on growth, but as a bet that the price will not go below the support level. Beginners often cannot understand the difference in this philosophy, but it is fundamentally important. Let's abstract from everything and I'll try to explain to you what the difference is. If we imagine a situation that the day is in a positive gamma exposure and there is a magnet level above the price, this is a surge of positive gamma. Absolute gamma is located there, and the maximum volumes for call options are located there. Then in this situation we can bet on growth with the goal of reaching a specific level. We can buy, for example, a call option. We can build some kind of butterfly. It doesn't matter now. The point is that we are specifically aiming at a certain level and understand why the price should rise there. If you haven't watched the previous videos, watch me talk about it there. At the same time, when we have a resistance level to which the price is approaching and from which it should logically turn around and go down, but we do not see clear guidelines from below where the price can fall, then in this situation we need to bet that the price will not go above the resistance level. And this is very important to understand when building trading strategies. The fact is that if in the framework of this example, you primarily act as buyers of options from the resistance level, that is buy a put or buy a bear put spread, then firstly, this position may not be cheap for you. And secondly, and this is the most important thing, in order to make money, you need the price to fall by. I managed to make a certain number of points before the end of the trading session. If you are primarily an option seller, that is you are building, for example, a bear call spread, then it will not matter to you how deeply the price drops. The price may not even fall at all. And at the end of the day it may even rise slightly. You'll earn money from it anyway. And the main beauty of the gamma exposure profile, besides the fact that they give you a fairly clear idea of what is happening on the market, is that these levels can change their status during the day. I mean, at the beginning of the trading session, we can identify for ourselves the level to which the price should go. We can take a position in the direction of this level and when the price gets there, depending on whether the gamma exposure Profile changes during the day or not. We can open other positions from this level. Either bet on its breakdown and further movement, or bet that this level will not be broken, or bet that the day will close near this level. We'll fix it as a level and resistance. We can focus on the gamma flip zone if it is above the price. If after the gamma flip level the positive gamma values are less than the negative gamma values, this will further strengthen the signal that the level will not break up. If the price is in a positive gamma exposure, then we can focus on large positive gamma values as a resistance level after which the gamma exposure begins to decrease. If the price is in negative gamma exposure, then we focus on large negative gamma values above the current price as resistance. If the price is in positive gamma exposure, then we rely on large gamma values as support levels which will be from below. If the gamma flip is below the price, then it is also perceived as support. If the price is in negative gamma exposure, then we focus on large negative gamma values that are below the price level. Also always look at the absolute gamma value. This will always be the level to which the price will react. And of course keep track of the values for call and put options so that they do not contradict the general logic. I mean, if the price is at the level of 6,000 points, for example, large positive gamma values are at 6,050, but at the same time the maximum absolute gamma values are at 6090 and the maximum call options volumes are at 6110, then in this situation the level of 6050 large positive gamma values should not be perceived as resistance because that there are serious arguments that it will be broken through and the price will go up. I understand that it will be difficult for many beginners to master all this information right away. There are many levels, many columns, but trust me, if you look at these charts in real time for at least a month, you will very soon learn how to filter out all these signals, discard those that are not of fundamental importance and focus only on important levels in general. You will be like that dude from the Matrix who sat looking at the monitor on which some numbers were running and at the same time saw the whole picture. In conclusion, I will answer another question that may arise and where to get all these values? All this is on our website. All members of our community have access to it. And there you can look at these parameters in real time. And not only using SPX. You can watch shares of ETFs and much more. And on this site, in addition to the parameters described above. There are also graphs on which these values are plotted, and there are graphs that show key support and resistance levels. But we will have a separate lesson about this later.









