How To Find The BEST Entry Zones
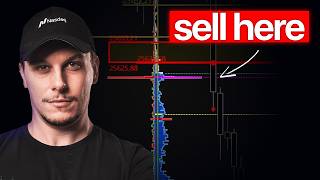
Kardec Trader shows how to use the delta print indicator and deep charts platform to identify optimal entry zones through order flow analysis. The tutorial focuses on refining your approach to find the best places to enter trades.
Chapters
In this video I will show you how I personally refine and identify the areas for the best entry using order flow. Specifically we will see one indicator that show you the exact area called delta print. This is not based on some support and resistance or technical indicators, is based on actual order flow data that got executed previously. So. So don't expect that this area can be seen only from candlesticks. Hello everyone and welcome back to the channel. In this video I'm showing you two execution that I took one in London session and one in New York session using this order flow suite of deep charts based on fixed profile volume analysis and deep trades analysis of the momentum of the market. So we need to start with the profile shape. The first thing that I was checking here is that the London session starts with clear.
Breakout of the previous level. A lot of aggression here and they created a condition of trend scenario. Why? Because they accepted after the breakout below the value area low. So as you can see in this condition we are seeking new balance of price and. And what we can expect here is direction. So I didn't took the first movement because it was before the opening of the London session. But the second movement was so clear what happened here. You can see that here there is this area, okay? And this area is based on the profile as you can see of the previous swing point. This is dynamic, okay? So you can measure how much pressure there was in the market during this win point using the delta profile and using the big trades. As you can see, the most important price level and we don't need discretional analysis here because you can see is when the volume got support by these big trades. And this is the reason you see there is a lot of delta pressure on this area, okay? So what we can expect is that if we want to continue to go short, we will reload other aggressive short position from this area. So you can just put an alert here. It's nice to notice also that the value area high it's here. So you have a confluence of value area high, big trades and delta level. This one is a super strong area. What happens? The market tried to approach this level. But as soon as the market approaches this level, you see aggressive sellers really strong here. And I will show you how much it's useful to see dynamic data entering. Please take care about this part of the charts and watch as the price develop. Okay, Bomb. You see all this volume? This is what they did in these big trades. And now we want to check if buyers can break this level or they will continue to be on this one because the pressure of the seller is super strong. So we trace this level, we we have our area and this one it's already an execution that you can make protecting yourself above the area that we already identified. Okay, now what the market does is that it tried to break these big trades, okay. But it collapsed down again. So as you can see we can expect that in the fractal analysis we have another strong area that will be protected by by these aggressive sellers. And this is exactly what's happening. So you can take also a reentry here covering above the area targeting for a swing point. This is a 1-2-312-4125. It depends on how much you want to be safe on the stop loss placement. By the way, this is our deep charts platform that is finally available at a super discounted price only for the next few days. So if you are interested in learning order flow and having an actual platform platform that show you real data. If you want to join with my link in the description, you will also get included one month educational boot camp. Other than this, we see that the market create again a new dealing range. So after you go to take profit on the first one, you have a condition again of super strong swing point, super aggression of the market. Okay. Really directional. And if you put here the fixed profile, you see that the most relevant area that you have here is is this clear volume ledge. Volume ledge is where the volume goes from really peak point to really low point. Okay. So from high volume node to low volume node really fast. And if we want to be precise, this area is this one. Okay, but you cannot just execute based on this. So you need to go to check what's happening here in details. And if we go in details to see what is happening here, we can clearly see that this battle of the sellers got won by sellers. Why? Aggressive orders, deep trades in the body of the candle. So actually following results and absorption of the aggressive buyers. What does it mean that in this battle to create this down movement, buyers try to take control again but they got absorbed. So all these from the aggressive sellers to the absorption of the buyers become our area and the market like to retrace and go here. So you can see that here control of the buyers, control of the buyers, control of the buyers, control of the buyers, failed buyers. Okay, so this kind of information is not based on delayed data. You have this information in real time and you can use them as a confirmation to execute your trades. Okay, this one could have been another amazing execution with really high probability. Following the direction of the market. Okay. Now, if we go to analyze what's happening here. We have absorbed buyers. Aggressive sellers that put a lock on the movement. And again, absorbed buyers. Okay? So after this candle, the situation is super clear. So you can already put a limit order here, here. Okay. From here, the market collapse. This is a really clear understanding of auction market theory. Sensitive high probability reversal area. Following the direction of the trend. And trigger execution using deep trades. That is based not on some fancy algorithm or secret source. The move the market, but actual execution. No conspiracy theory, just visualization of order entering the market. Remember that the only thing that move price is volume. You need an execution for the market to auction high or down. I hope you enjoy this kind of content. And I will see you in the next one.









