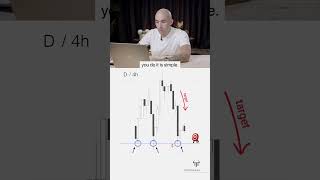
Price moves toward where stop-loss orders cluster. What looks like a safe entry on the daily chart is actually a trap. Drop to lower timeframes, find where the market sweeps past recent highs, and trade toward the level loaded with opposing stops.
Chapters
Once you see where liquidity is sitting, the chart tells you exactly where price is going. You don't need to predict, you don't need indicators, you just need to know where the stop losses are stacked, and the market will do the rest. There's one belief that's costing you more money than anything else, and it's this: when a key level holds, that's confirmation to enter. That's what every course teaches, that's what every YouTube video says. Price bounces off support, it holds, now you have confirmation, go long. And it makes sense on the surface, but it's wrong. So the belief you need to replace it with is this: when a level holds on the 4-hour or on the daily, that's not your entry, that's your target. And you wanna sell into this level, not buy from it. And the way you do it is simple: drop to the lower timeframes and look at the other side, the highs. Once the market sweeps them, that's your entry. Your stop goes above the extreme, and your target is the level on the higher timeframe that's loaded with all the stops from traders who still believe it's holding. The moment you stop seeing levels holding as confirmation and start seeing them as traps, everything about how you read the market changes.