How to see Smart Money on-Chart #smartmoney #trading #orderflow #forex #futures
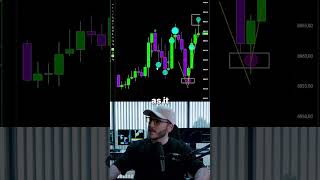
In this short instructional video, the presenter demonstrates how to use the DeepCharts platform to visualize large, CME‑aggregated trades—referred to as “smart money”—on an S&P 500 E‑mini futures chart. By opening a new price chart, selecting the Deep Trades indicator, and setting the filter to 150, only the biggest trades appear as bubbles overlaid on the candlesticks. The speaker then explains how to read these order‑flow signals: a cluster of buyer bubbles on a top wick indicates that buyers were absorbed by a dominant seller, suggesting an imminent reversal; a large sell bubble on a bottom wick shows sellers being absorbed by a dominant buyer, also hinting at reversal. Conversely, when buyer activity is present but aggressive seller bubbles cause the candle to close below the open, sellers are in control and the price is likely to continue lower until a big seller is absorbed, at which point buyers regain control and a reversal may occur. The video concludes with a call to follow for more order‑flow tips.









