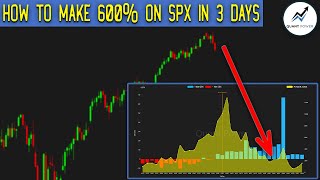
A trader (Kardec Trader) explains a short trading case study from late July showing how analyzing SPX gamma exposure (GEX), power zones, option volumes, and technical indicators enabled a diagonal put spread trade that produced ~600% profit in three days. The explanation identifies key intraday levels (resistances at 6460, 6420, 6400; gamma flip zone ~6375–6390; support at 6350), describes the power zone behavior around 6400, and gives trade entry details (sell 6255 put expiring Aug 1, buy 6265 put expiring Aug 4) conditional on a break below the gamma flip.
Chapters
Today I'll explain in detail how you could have made a 600% profit on SPX in just three days at the beginning of this week, our community discussed the overall market situation. The main takeaway was that if Jerome Powell kept rates unchanged and failed to send clear signals about a potential rate cut in September, it could trigger volatility as early as this week. In a follow up post we noted that from a technical analysis perspective, the market remained overbought. We observed a significant deviation from key moving averages, RSI divergence and the Fear and Greed index was in extreme greed territory. Additionally, the Smart Money Dumb Money indicator showed that Smart Money was losing interest in the market. However, based on such indicators, we can only assess the broader market context. We can't make trading decisions solely on them. The market has been extremely overbought for a while now and it could easily remain overbought for several more days or even weeks. We understand that tension is building up, but to pinpoint the exact moment of reversal and catch the perfect entry point, we analyze the gamma exposure profile on that day, July 28th, SPX opened at 6395 points. Let's discuss all key levels. 6460 represents the strongest intraday resistance level. This is where we see the largest positive gamma values as well as the largest absolute gamma values. When we plot these levels on the chart, they're marked as P1, indicating the highest positive gamma and AG values. We label this level as resistance 2. At 6420 we observe the second most significant positive gamma values along with the second largest absolute gamma values. Additionally, the 6400 level showed maximum call option volumes. These levels are also plotted on the chart and marked as Resistance 1 zone. The next important level was in the 6,375 to 6,390 range. This is the gamma flip zone where gamma transitions from positive to negative values. As I've mentioned many times, this area always serves as either very strong support or very strong resistance. Since on that day this level was below the price, it acted as support and was further reinforced by maximum put option volumes on the chart. This level is marked as g flip and support one. Finally, the lowest support level that day was at 6350 representing the largest negative gamma values on the chart. This is the N1 level labeled as support 2. To make navigation easier, all these key levels were described in our community. And now we get to the most interesting part. Looking at the power zone distribution on July 28, the peak values were concentrated at the 6,400 level above 6,420 the power zone values dropped sharply. In my previous video, I explained in detail that the power zone serves two functions. It shows peak values and a range. The peak values indicate a level that tends to attract price action. When we talk about the range, we should visually imagine a square containing the highest concentration of values. This is where the price will naturally gravitate. In this case, we can see that moving above 6420 made no sense for the price as power zone values dropped dramatically beyond this level. Although the 6460 level stood out prominently, we didn't view it as a target for upward movement that day, but rather as a strong resistance level that would reject the price downward toward the power zone if it ever reached that high. But again, since power zone values declined sharply above 6420, a breakout above this level was extremely unlikely. Similarly, we observed declining power zone values below 6375, meaning there was no reason for the price to fall below this level either. Our community posted an analysis stating that the power zone's peak values were currently at 6400 and this level would try to maintain the price for as long as possible. However, the price was trapped in a narrow range, 6,400 acting as resistance and 6,390 to 6,375 as support. If the price breaks below the support one level, we'll transition into negative gamma territory which would increase volatility. In this scenario, you could open a diagonal put spread on spx by selling a 6255 put option expiring August 1st and simultaneously buying a 6265 put option expiring August 4th. This position can be held until Friday, August 1st. Let me emphasize this once again. At that moment the price was in positive gamma territory. In other words, we were in bullish territory and this position should only be opened if the price drops below the gamma flip level. Until that happens, bulls will keep fighting to maintain control. That said, even though the gamma flip zone represents strong support, I explicitly mentioned that I didn't want to open long positions. The main reason was that the 6,400 and 6,420 resistance levels were hovering dangerously close overhead. Put simply, I wasn't willing to take on excessive risk just to chase a potential 20 point upside. Looking at Monday's close, we can see that the support level held, preventing any downward price movement, which meant we couldn't enter the diagonal put spread. A confident breakdown of the support level would have been necessary for this trade. However, the situation began changing on July 29th. At the start of the day, the gamma exposure profile looked like this. The 6450 level showed the largest positive gamma values marked as P1 on the chart, but it was too distant from the current price to act as meaningful resistance. That day, the nearest and most significant resistance stood at 6400, where we observed peak absolute gamma values, maximum call option volumes, and the highest power zone readings before their sharp decline. Essentially moving above 6400 made no sense for the price that day. The key support range was 6385 to 6375, which is the gamma flip level. Our community posted an analysis noting market weakness with bulls and bears battling over this gamma flip support zone. At that moment we were seeing a bounce toward the power zone's peak values and the quant power line, which together formed a resistance area. This entire setup was captured in the screenshot I shared where I explicitly stated my intention to open the same diagonal put spread we had discussed on Monday, selling the 6255 put expiring August 1 and buying the 6265 put expiring August 4. The core idea was that on Monday the price was trading in positive gamma territory, making it impossible to open such a position until certain conditions were met. But by Tuesday, the market began showing weakness. The price was preparing to break through the gamma flip level and the entry point looked very attractive. What's interesting is that the gamma exposure profile started signaling upcoming market weakness even before the interest rate decision and the earnings reports from tech giants. In the end, after the G flip level was breached, the price moved into negative gamma territory. Volatility began to rise and the decline accelerated. By Friday, this position had generated a 600% profit. If you're hearing about these concepts for the first time, I recommend checking out the dedicated playlist where you'll find answers to most of your questions. In conclusion, I will answer another question that may arise and where to get all these values. All this is on our website. All members of our community have access to it and there you can look at these parameters in real time and not only using SPX, you can watch shares of ETFs and much more. And on this site, in addition to the parameters described above, there are also graphs on which these values are plotted and there are graphs that show key support and resistance levels.