I Build You a Profitable Trading Strategy in 10 Minutes | €1,000,000 Trader Battle Episode 4
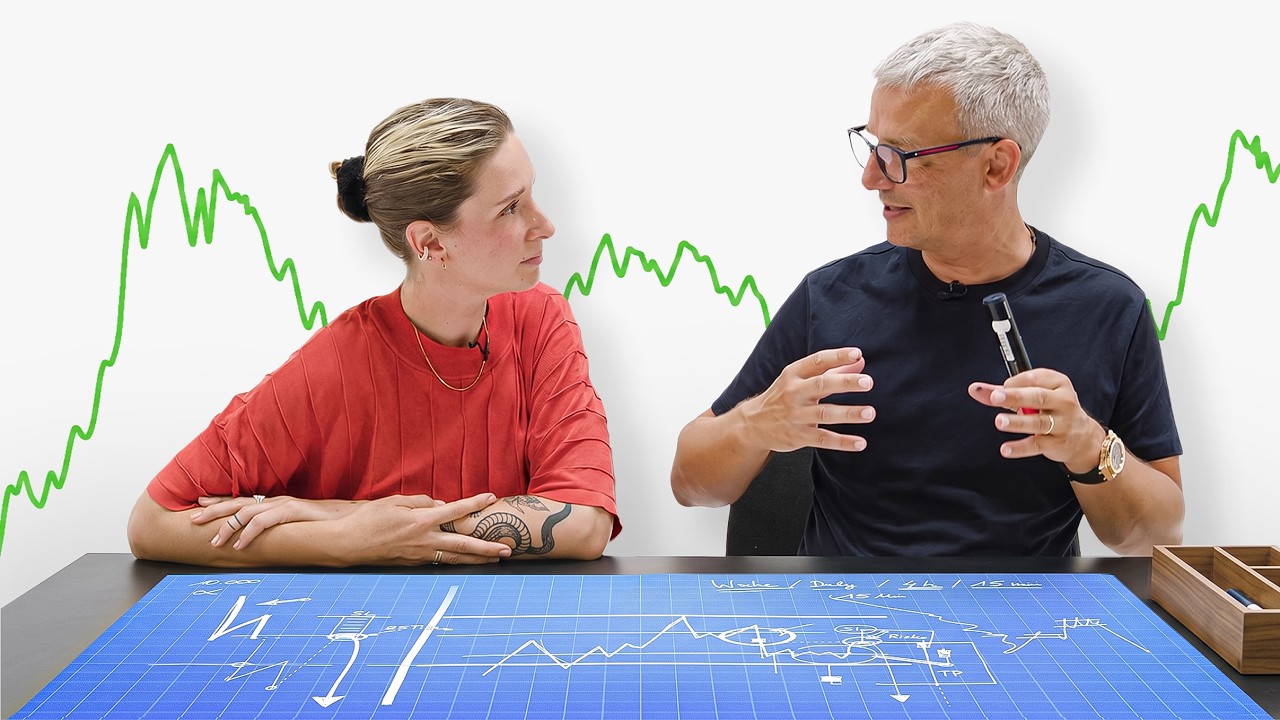
Kardex Trader evaluates four traders pitching short-term strategies for €1 million. Christian uses gold CFDs with volume profile but lacks stop-loss discipline. Heinz trades futures with multi-timeframe analysis but trails stops from fear. Frank uses order-flow footprints with 3:1 risk-reward. Katharina trades EUR/USD zones but needs more trade data. Kardex emphasizes: precise stops, risk-reward calculation, 250-300 trades to verify edge, and psychological discipline.
Chapters
Because if you're not able to trade this strategy and you keep intervening, you'll never make any money in the end.
Never, never, never.
And now comes the part you don't want to hear. Please stop trading only one market. 4 traders are competing against each other today for €1 million and a free spot in my mentorship, which is worth €50,000. Each one of them has 10 minutes to present their trading strategy to me in its simplest form. In the last episode, I selected 2 out of 4. So, I definitely want to take you with me. I'd also really like to take you with me today. 4 traders are sitting in front of me. You'll find out who moves on at the end of this episode. I want to take both of you with me.
I'm Christian. I'm from Bavaria, Germany, and I've been trading for about 3 years. I focused on one market, and I've chosen gold for that, CFDs. I trade from 6 AM, so New York midnight. I look at what happened in the Asian session, if a significant low has formed. Then from the morning, I position myself and look and search for a range that is forming because I feel very comfortable in the area of counter trading and then look for a short winning streak within the range that I take with me. And I do that all morning until 12, 13 o'clock before I then go on a break. And from 14 o'clock, look again at what the CME does with the open before the Americans start. Then I look for a movement that confirms the future direction of the day, which I then get involved in again.
Hi.
Hi, Tom.
Hi.
Now you have to catch me up again.
You trade mostly gold as a CFD.
Exactly.
How high is the spread in gold for the CFD?
Depending on the market, relatively high.
Yeah, okay.
Then daily movement, New York session, and so on. How do you plan your trades? According to what concept?
I, uh, I start by planning everything according to specific business zones. I look at the Value Area High, the Value Area Low, the overall market profile, and the Point of Control or POC. And then I make sure to set my alarms carefully. I also take a close look at the previous day's highs and lows, and honestly, that is exactly where I prefer to set my alarm zones for the day ahead.
Great, I think that's conceptually strong for a start. Now the market is becoming lively. Do you have the Volume Profile or the Market Profile? What is that based on? What time period are you looking at?
The Volume Profile is currently set to the higher timeframe, but if you look closely, you'll see that's actually just the 15-minute chart.
Is that the entire previous day, the Volume Profile, where you—
your business zone with—
I picked those out and I've drawn them in.
Yes, exactly. Good.
And now comes the next question.
Now the market is starting to become lively. So are you telling me now that these exits actually take place at specific Smart Levels? And if I imagine now the market is running like this somehow and you want to enter a trade here, for example, a counter, where is your first profit target?
Nowadays, when I am trading at the POC, it has already become a common thing for me to exit my positions early. This is simply because I often see that I am already in profit, even if it is just unrealized gains at first. I prefer to lock those in rather than waiting for the market to potentially turn against me. And then suddenly a stronger movement runs against me, and that is, of course, annoying.
Good, that means you take profits relatively early. You just said something about risk-reward ratios. On average, how large are they?
Exactly, they are much smaller now than they were in the former days. We are talking about ratios like 1 to 2 or maybe 1 to 5. This is largely due to the fact that I was trading on much higher timeframes back then. Now, because of the short profit streaks and the incredibly fast market movements, sometimes even when I'm engaged in minute-by-minute trading, I simply do not stay in the trade long enough for those larger extended stretches to even be reached.
Do you keep statistics on your trades?
Yes.
What do you record in these statistics?
Currently, for the last month, I have been recording exactly who the winners and the losers were. It has been a very consistent process, and I've kept my journaling in such a way that I've noted what kind of counter it is, in which area, from where to where it moved. The VWAP is also included.
Now I have a fundamental question for you, and it's very, very important. You're saying here that you're achieving an 80% hit rate.
Well, that was exactly this past month, so—
What's the risk-to-reward ratio underlying all of this? Otherwise, that hit rate doesn't mean a thing to me.
Right. That's probably where the problem lies, that in order to avoid being stopped out too early, I sometimes change the stop, or I have changed it. And then, of course, I run the very real risk that a single outlier moving in the completely wrong direction basically wipes out several days of my hard-earned profitable work in one fell swoop.
Several days?
Yes, if I go down too far. So if I say I've decided for the week that I have a weekly maximum that I can lose, or I have a daily maximum that I can lose, and then I reach exactly that too quickly, then I stop.
Okay.
And then I have to work for another day or 2 to get back to that point.
Am I understanding correctly that you lose more on one trade than you earned, for example, during an entire previous day?
That used to happen to me, but I've been reducing it more and more now. And just through this structure and discipline, I also used to trade without a stop loss at times.
So let's take a closer look at this for a moment.
Mm-hmm, yes.
At the moment when you're planning a trade entry for yourself, now the market is moving up here, right? And here you enter your trade, which is supposed to go down. Where is your stop loss?
When the price is trading above the level known as the Value Area High, for example, it signals a shift.
So for example here?
Exactly.
And now honestly, I really don't believe that you always stick to that stop loss.
Yes, I do.
You do?
Yes.
Okay.
But maybe I've also set it a little bit higher and it's just not close enough to the level, you know, the predefined one. Okay, let me rethink that for a second.
But you definitely set it?
Yes.
Okay. And so, for example, your profit area, let's assume you plan the trade to this point, take profit. So does it happen that you then move your stop loss, or do you exit manually when you see the market no longer has what you like?
Depending on whether the wind shifts, if something changes, or if economic data triggers something, it could be that I close it manually. And I'm not working with a trailing stop right now. Stop. Exactly.
Okay, so this is very, very, very, very, very, very important so that we can evaluate whether what you're doing works sustainably. You must track your risk-reward ratios.
Yes.
Because do you understand the math behind it?
Yes.
Yeah.
Why aren't you doing it?
As I said, I have the Implemented the structure and discipline, and I've been taking it step by step. I realized that I simply couldn't change everything all at once, as it would have been too overwhelming. I really didn't want to lose my focus on the broader market trends or the macroeconomics driving our industry, so I decided to take a more measured approach. And that is my next step, clearly.
That is the step?
The step, yes.
It's not a step, it is the step. And if you don't take that step, you'll never know in the long run if what you're doing can actually work. Because when markets change their structure, without tracking these metrics, you have no what's called expected value per trade. That means if that is, for example, at 0.81, you will never make money. If it's at 3.7, you'll be rich as a king. But usually the truth lies somewhere in between. But you can only determine that if you document these metrics for yourself. You absolutely must do that. It's simple. If you need help with that, super easy. But if you don't have a handle on that, it suggests that you just don't want to do it. That's a decision that you have to make.
That's good.
Then I'll summarize it here.
I think the strategic approach is basically good for a start. The question, however, is how the risk management actually takes place in the end. And of course, if I can't determine metrics for myself in depth, I'll never know what my expected value per trade is, respectively. What kind of consecutive stop losses do I actually have to be able to expect? And that is the absolute alpha. And that's really all. Thank you.
Thank you.
Hello, I'm Heinz from Austria. I'm 55 years old. I've been living here in Cyprus for exactly 2 years now, and I've been trading actively for a year, mainly on the NASDAQ. I still trade the NASDAQ, S&P, but I also trade gold now and occasionally coins— Bitcoin, Ethereum. I like to trade breakouts, reversals, rejections. I draw in my lines, so actual potential zones where rejections have often occurred or where there's resistance. I also draw in fair value gaps. What do I use for that? Partly the RSI as well. That's how I proceed. I look for the bias, of course, the right one, so that I know the direction where the whole thing is going. That's my approach. I'm not profitable yet, but I'm moving in that direction. Hopefully.
Hello, Tom.
Hi, good to see you.
So, let's first take a look at what you're currently trading, just to make sure I've got it right. So Nasdaq, S&P, and gold are markets you like, and you trade both breakouts and reversals?
Yes.
Okay. And your resistance levels, which you basically pull from the chart for yourself, how do you do that?
Well, usually I go ahead and take a look at the weekly chart. I start by going down through the daily chart, then move to the 4-hour, the hourly, and finally the 15-minute time frame. Once I have those set, I carefully draw in all the key resistance levels that I can identify across these different time frames to get How do you determine the resistance levels? Rejections. I look for the rejections or where the reversal was.
So purely technical?
Yes.
Okay.
I use those, and then I also work with the volume profile, and I also mark the previous day's high and low. I also start my day quite early in the morning. And I make sure to get to the market, getting there really quite quickly to set everything up. Just stay here for a few minutes longer, check everything, mark it out, and then step away from the market. In the afternoon, I go back to the market. I've already got it marked out. I repeat that, see how the market has moved, which direction it's going, and from there I actually start looking for entries.
That's quite a lot that you're doing there.
Wow.
Okay, now I have a question. Why do you do weekly, daily, 4-hour, 15-minute? Do you then transfer all of that into, for example, your currently running chart? Because then you have— if I imagine it like this, let's make the weekly red. Now we have, for example, here and here an interesting resistance from the weekly chart. Now let's do 4-hour. I'll deliberately leave out the daily for now. Then you might also have a level here and here from the 4-hour chart. Is that correct so far?
Yes.
Okay, and now it actually goes even further than that. You should now take a close look at the specific chart I have drawn here in blue, for example, focusing on the 15-minute timeframe. And now, with that context in mind, you are ready to start looking for a potential trade setup. How would all of that help you now? What exactly would you, if we were to really look in with a magnifying glass, what specific details would you be looking for here right now?
Well, it's already struggling a bit here. I'm already looking for gaps here.
Wait, what kind of gaps? Let's assume the market made a gap here. I need to understand this now, otherwise I won't quite get it right. There's a gap here now, okay? And here is the current price now, and it's heading this way.
Yeah.
What function does the gap have now?
I'm of the opinion, or rather I've tested it often, that it very, very frequently makes a return move during this period. And only then it finally continues on.
Okay. And at this specific moment, right as the price approaches the gap here, what exactly needs to happen for you to feel confident enough to make a trade?
Well, I must have seen by then. So here he wants it to have already broken resistance once. Comes back, breaks again, closes below it, runs back to the gap, and that's where I look for the entry.
And from there you want to trade down here?
I want to trade down then.
Okay, conceptually that's cool for a start. The risk management, I don't quite understand that here yet. Because if we enter here, for example, where would the stop loss be?
At the end of the gap. So, a, a bit above the gap.
So, for example, here, right?
Yes.
So, when you really look at it, that ultimately means there is some risk. And down here, below the low somewhere, would be the take profit, right?
Right, yeah.
Okay.
Or if the trade is performing well, take your profit and move your stop loss further up.
Ah, okay. Then you trail the stop.
Okay.
Well, trail take profit, or you can, if you're really in with 2 units, so with 2 lots, already take one out so that a certain profit is already there. It reduces it, of course, but that's how I proceed.
Hugh, that's a lot of information that—
Yes, unfortunately, I look for a lot.
I think it would be very, very helpful for you to define this gap here once more. How did that come about? That's a price gap that arose from the previous day.
No, no, that in these 15 minutes, so that I.
Okay.
That is really a shorter trade.
Ah, okay, okay, I see.
Okay. I already have my price gaps within the movement.
In this movement.
Okay, now I've understood that. What do you use? Do you use CFDs or do you use futures?
Futures.
Okay.
I very rarely recognize gaps there, especially in the S&P or something. I actually never see gaps there.
The fair value gaps, they are marked by the candle.
We're talking about the fair value gap?
Sorry, yes, fair value gap.
Now we're speaking the same language. I'm talking about intraday gaps the whole time where a market has a price.
Sorry, sorry, sorry, sorry. No, fair value gap.
Now we have a completely different structure. And now I've understood it.
Okay.
Sorry.
Now I can evaluate the whole thing as a completely different analogy for myself and can also say it's a cool idea.
Yes.
But now I wonder if you trade it like that for yourself. You have momentum alpha. The market shows you momentum via the corresponding fair value gap. Okay. That is already great information to know that the market has sold off impulsively. Now, the next thing is you wait for a break of this structure right here.
Yes.
And looking for another break, which clearly indicates to you that the market is very weak. It is a telling sign.
That it, that it wants to go there, right?
Yes.
Exactly. So, and now it runs up to the fair value gap, and that is where you make your entry.
Yes.
Clear so far?
Yes.
There is a possibility even before that, either at the end of the gap, the fair value gap, that it closes completely.
Yes.
So that it really respects it, saying now it is going down. Or otherwise, it really just comes down to a gut feeling I have regarding exactly what lot size I'm currently in and how much risk I am actually willing to take on these specific trades right now. I am not so sure there.
How do you define your lot size here then? Let's assume you have an account of €10,000 or €100,000, it doesn't matter. How many lots would you push in here then?
In reality, I do not want to lose more than, uh, 100.
Mhm.
And, uh, the goal is to win 200.
Mhm.
And if you decide to place your stop loss right here, right now, and let's just say it happens to be 25 ticks away, then you really need to take a moment to calculate in advance exactly how many units you can afford to use to make that specific trade, don't you? It's all about managing your risk properly before you even enter the market.
For example.
Okay, great. Then we are clear on that. That is very important to me. Okay, that means you define the number of units based on your stop-loss size firmly beforehand.
Yes.
Okay. Now there are simply 2 things that are important. If you take this path here in a market environment where you have already been given proof twice that the market is weak and it works like that, I see a strategy here.
That works.
And I'm asking myself now why you are not making any money with it.
Because, as said before, it actually works very well. So the only problem is actually that I then do not trust the whole thing, or I do not trust myself. And as I said, I trail the stop loss so quickly already that it then takes me out again during small pullbacks.
If the market runs here now and it makes a counter movement here, you have already trailed your stop loss to here.
I am already in very, very early then.
Exactly.
And then it pulls me out very early, and I make very small profits as a result. And if it takes me out at the stop loss though, the loss is bigger, and so on. That makes me unprofitable.
Have you ever done a statistic on how much money you would have theoretically earned if you hadn't trailed your stop loss?
No, not a statistic. Not a statistic, but I, uh, see it every time.
Good. Then, for your very first task, I need you to carefully determine exactly how often my strategy would have actually worked Out if I hadn't intervened at all. Specifically, take profit below the supposed last low. Entry where you choose it, stop loss where you choose it, and then please check at least 200 trades what kind of average risk-reward ratio would have resulted and what would my average hit rate have been. That will open your eyes. That is what we call an edge, which is essentially a strategy that consistently has a positive expected value. And B, it will inevitably lead to— and I am really getting to that point right now— you absolutely having to stop trailing your stop losses, because that is just not the right way to manage your risk. Because— and I really want to take a moment to explain this clearly to you right now— a stop loss order always belongs exactly where I would expect the complete opposite of my intended market movement to occur. I expect the opposite of my movement up here, that the market now goes long because it knocks out the strong seller.
Yes.
So, so why should I trail my stop loss if I only expect, only expect the opposite of my idea up here?
That's right. I'm saying it's fear.
The fear, it lingers.
Exactly.
So, and now the question is, why do you have such a great fear of loss in trading?
I don't know.
Good. Then I would have to say that it is a rather complex issue, one that I can only truly resolve by putting in a significant amount of time and doing quite a lot of work to fix it.
Mm-hmm.
Or perhaps it is time to look at what is happening inside your mind that causes you to have such a deep, overwhelming fear of loss.
Mm-hmm.
Because if you're not able to trade this strategy, and you keep intervening, you will never make money in the end. Never, never, never. You have to realize that.
Yes, I have to work on it.
You have to work on it. But one thing I can tell you: what you're doing here is cool.
Mm-hmm. Thanks. Yeah.
And honestly, I think that of all the incredible things you just described to me, it would just be such a shame if you didn't start making real money with it. It really would be.
Yeah, I see it that way too.
Maybe briefly summarized, the strategy I just had presented to me here is valuable. In my eyes, it's functional because it always brings several aspects of proof with it before an entry is even planned. The problem is, of course, if you trail your stops because you're worried that you'll give too much back again, either can't crown your being right, or as in this case, fear of loss justifies the whole thing, then you always have to look at why that is. What's the story behind it? And I want to say this very clearly. That's nothing anyone has to be ashamed of. Yeah, because we're all shaped by some behavioral structures or whatever experiences that simply lead to that. I think that's really important. Cool strategy, and I'm really glad that you presented it to me. Thank you very much.
Very nice. Thank you.
Super.
I'm really happy about it.
Yeah.
Thank you.
Before we get back into it, a quick notice. World Class Edge just launched. And if you want to know How really institutional traders and market makers actually trade? Click the link below and secure your spot at World Class Edge. All right, back to it.
I'm Frank. I'm 52 years old. I live in Mallorca, and I'm a full-time trader. I've been doing this for a year and a half now. I primarily trade the S&P. Additionally, depending on how the market phase develops, I also like the Nasdaq. My trading strategy is a classic extreme rejection strategy. That means I the mark out the corresponding zones. That means zones in the context of value areas. Uh, they are daily as well as weekly and monthly. Sometimes they tend to overlap, which intensifies the whole game a bit.
Yes.
And in parallel, I also analyze the markets with a TPO, um, to recognize trends and, and, uh, balance. All in all, that gives me a bias, so an overall bias or big picture. Uh, and below that are major and minor trends. And at the points I've marked, I wait for the setups that show me Do I do a breakout? Do I do a reversal under certain circumstances? Although with reversals, I'm still just testing things out. I'm not quite so confident there yet. Uh, and otherwise, I look at the order flow and price action for confirmation and wait for the signals to say go or no-go. A risk-reward ratio of 3:1 is the minimum. That's how I enter the market, and I might even be bold enough if it looks right to move the TP to a 4:1 Not always the best idea, but sometimes it's great.
Hi, Tom.
Good day, Frank. So, you just mentioned that you trade extreme rejections at zones.
Extrema rejection.
Ah, that's why I misunderstood.
Not the extreme, but extrema. I mumble sometimes as a Swabian, please forgive me.
Yes, I see that. Let's make a concept. Let's imagine a market has this structure. These are all value areas, and day X has arrived. Yes, day X means here is where the market is currently, and you're looking for a reason again why you shouldn't trade. And now let's go ahead and select it all a bit more nicely and say here's a value area from the previous day. Here is a trend profile. This is supposed to be the point of control. That's the value area at the bottom. That's the value area at the top. And here is another balance profile.
That's from yesterday, right?
Exactly, that's yesterday. And here the market is now starting to trade. And we get to here. What do you do now?
I'm looking, for one, at the price action. How did we get there? And I'm looking at how my footprint chart looks. That means who is taking over or who has just—
Price action?
Yes, order flow in the footprint.
Order flow.
Yes, I'm just looking at the—
Trend.
Exactly. I'm basically looking at the market orders.
Should we add delta to that?
I have the CVD with me, of course.
As we're noticing right now, you're already including a lot of information immediately to evaluate the moment a market even goes somewhere. How is it moving there?
Exactly.
Does that make sense?
So far, I've assumed so, yes, because I have to, or I want to understand why the market is doing something and how it comes to be there now and what can happen then. I'd say the classic is at the Value Area Low. After a profile like that, the first contact might be a rejection. It could be... I would expect that. That can then be confirmed for me, meaning, if it goes back from here, tests the value area again, and then finally my footprint shows me there's a strong buyer down there who doesn't want the market to go through and is working against it with pressure. I used to always use the heatmap.
The heatmap? Can you use it?
No, I don't mean that anymore.
Then at some point it's too much. To see if the limits are just being topped up again and again, then I say, okay, that's my entry. But not into the pullback, meaning I don't put, I don't put my limit there, but I wait until I have a counter candle, and then I go to the end of the candle. That's where I get in with a stop order.
Look at what I've drawn here. The very first thing—
Yeah, that's a downtrend. I know that already.
And down here, we're now looking for a long trade?
Yes.
Okay, so we're trading completely against the trend.
Yes.
And if we want to trade completely against the trend at this level here, what makes you think the trend is over?
Well, for one, that the market has ultimately formed a balance through this downtrend here. I wouldn't now— well, it could be if it shows me here that it breaks through, then it continues. But if it shows a reaction here and also showed us this value area where the market feels comfortable, Then I'd expect if the numbers show it that it stays in this balance because it's already opening inside the balance and not outside. That's why I'd expect it to just stay in there and at least go back to the point of control or maybe to the value area high. But the numbers have to show me that.
Let's zoom in on this, okay? Previous day's value area, previous day's point of control. Maximum downtrend. And here was the market opening. Now you said the market is coming down here. You're already looking from 6 different perspectives at how it's moving there. And now the market is going up here. And you're considering whether a long trade could make sense, right?
Yes.
I like to tease you a bit.
Yeah, go for it.
And now we're also looking at the footprint chart and the cumulative delta. Is it rising or should it be falling? How do you prefer it?
In this case, I'd like it to be rising.
Rising, that's great for a start. If that is rising, and now let's take it a step further. Previous day's low is here. Previous day's high is here. How long is the market valid for there to be a probability of turning long at all?
I don't know that.
Good.
This price range here is based on the assumption—
Still—
Actually, it is not extremely short.
Yes, the rejection zone.
That implies that this specific setup you are currently utilizing here could, in theory, also be replicated and occur over in this location as well.
Yes.
Where would you think the setup is better? Specifically with a balanced profile.
It's probably better if it's lower.
Exactly.
That wasn't hard, the question, the way you asked it.
But it's important, because just now I got a different answer.
Well, I do it differently too.
Oh, so you do it too.
I do it that way, but I wait for the retest here. That means first rejection, market comes back. Second rejection. Then I just need the defined information. Cluster engulfing, you name it. And if that's the case, then I'll go long here after the well after the retest.
Where's your stop loss if you go long here?
Below. Below where? Below this last breakout candle.
Place your stop loss below the reversal candle.
Yeah.
Does that make sense there?
It just hurts. It's way too big, and if it hits me, it ruins everything.
That's totally stupid, right?
Yeah, that's just how it is. But I also tried using a fixed one like 40 ticks, 50 ticks, or 20 ticks.
What kind of market do you like to trade?
I actually like the NASDAQ for one, but it's gotten a bit too fast for this little game here. That's why I switched over to the S&P. It's much more relaxed, but then really only 1530 to 1600, maybe until 1615, then it gets too slow for me.
Okay, I would definitely recommend the following to you. If you want to trade something like that against the trend, please only look in this area if you want to go long at all, okay?
I just want to learn reversals too, that's why I'm actively doing it.
I know, but it's no use if you get hit by many stop losses because you set them in a price range where an aggressive downtrend prevails and the market isn't even in imbalance yet and returning to equilibrium. Because if it hasn't tested the imbalance and says the downtrend isn't continuing because it's returning to equilibrium from there, you usually don't have a good location with the normal value area level. You see the combinations that are important to think through. That's the first thing. The second thing is the stop loss. If you get a setup here, is suddenly in a price range where the market goes below the previous day's low and most likely continues its downtrend. So it's a much more logical level. And now comes the part you don't want to hear. Please stop trading only one market.
I tried that with four markets.
You're not supposed to trade them simultaneously.
It drives me crazy.
You will. You should only trade one market. But what if you suddenly go and set a signal on the value area and wait until the market here? Among the four markets gives a signal. I'm at the value area now.
Who, who, who?
I'll bet you anything you'll never have more than two markets giving you a signal at the same time. Imagine you take soybeans.
Next thing you know, it's orange juice.
Corn? No, definitely not. I only want to make one point that you can spread more risk and look more into locations. Specifically at your setups and your ideas, so that you can collect more trades. Because I know you're someone who wants action, and you want way too much action.
Possible.
It is. And this strategy, as we've just drawn it here, and I also know to some extent where you stand, will most likely not lead to good results, because you want action just for the sake of having action. At a price level that isn't really beneficial for you. Always start with the simplest thoughts from a supply and demand perspective. What's currently happening in the market and where is a location where the market would absolutely have to turn to even do the opposite? And then of course put that into context, for example, with funds, with volume peaks, and so on and so forth. We're getting very complicated now. But, and this is also important to me, that first part where you said you're already looking at 1,000 things. What happens to that? Because now all of a sudden, when you set signals for yourself—
It's gone.
It's gone? What do you do with all that time?
Play golf? No, of course not. I have to be at the computer quickly.
Yeah, but you don't have to be at the computer quickly at all, because when the market gives you a signal, you first need the setup that then constructs itself. Do you see what I mean? So let's do the following. I understand that this approach might not be your preferred method, but I need you to trust the process because we are moving forward with this strategy regardless. The absolute first thing we need to focus on is conducting a deep, thorough analysis to identify exactly where and when specific trades actually make sense for our goals. Included in that is the trend and the corresponding levels. The second thing, set signals. The third thing, when it alerts you, do you wait until the setup is ready, or do you like to jump in when it's almost ready?
I would want to wait.
Great. Please wait patiently for the entire setup process to finish completely. Now that everything is ready, what exactly is there for us to do next?
Let the entry run.
Okay, so we'll make our entry right here, and then we'll just sit back and let the market decide where it wants to go from there.
How do I manage to get into the pullback with these limit orders? I just can't get that into my head.
No?
No.
Okay, let's take a look. Let's use the magnifying glass again, okay? And now we'll zoom in here, okay?
Yes.
Where the setup occurs. Let's assume this is the level. The market goes down here, for example. It creates a wonderful setup for you here, for example, via the footprint chart. You see a finished auction down here. You see that the cumulative delta is rising down here. Everything is fine. And now this is also pretty cool for you guys out there. Take a look at where here The highest volume was in this whole thing, and now the market is going up here, and you're not in on it.
Yeah.
You know that, right?
Yeah.
Exactly.
So, and now if you take a closer look right here, tell me, what does it actually look like in there? And now the market is back in this area. First, you'll be annoyed, thinking, I should have bought. And then you'll realize, now it has played the highest volume here, for example, again within this area. And now you have to wait for it to get exactly there. And that's where you enter. Of course, you have a huge risk there. But where would you place the stop?
It is probably either down below here.
That's where you place your stop now. And then you have a super coherent concept. Here the market tells you it's over. Here the market tells you I'm proving that I'm accepting the balance again. And here the market says I'm buying just above the greatest equilibrium of this level and placing it below the I've maxed out area below the stop loss. And now you have a super clearly defined risk that is also smart and includes everything that fits your context analysis. And now it's time to close your eyes and wait. Next level, first the point of control, please. Even if it's a balance profile, it's against the trend. For this trade in a sideways phase, I would definitely say it has to go up to the value high. Yeah?
Yeah.
Does that make sense to you?
Sounds totally logical.
Good, let's do something. So the first thing I saw is it's always important to include the trend 100% in the whole concept. If you want to enter markets against the trend, it makes sense to do that in price areas where an equilibrium was left and then finds acceptance again, and not already at the equilibrium boundary, because the probability that it will peak out if it's running steadily in the wrong direction in the trend is just high. The third thing is, setups are welcome to come twice. That means once completely down and then already back in the accepted balance. That gives you a much higher probability that the market will then take you along for the ride. And yes, the fourth thing is to develop the patience to actually do it. And that's all there is to it.
It was great.
Yes, I'm Katharina. I live with my family in Berlin and I've been trading for almost a year now. I trade the Forex, EUR/USD specifically, now and then also the DAX, but I've specialized more in the EUR/USD. In the end, I look at what the market offers me. I trade momentum, pullbacks, reversals, and trend continuations and have special signals for that, which then give me the go or not. I basically always wait until the market reaches a certain zone that I've marked in advance. And then I wait for candlestick patterns, for example, and I always wait until the candle closes. I trade on the 5-minute chart, and exactly before the candle hasn't closed, I don't enter. So I'm very clear that I really only trade from 9 to 12 o'clock, and I definitely want to be out before economic data so that even if I enter shortly before 12 and the trade is still running, yes, I exit at 4 Hi, Katharina, I'm very happy to be here.
I'm happy to be here too.
Especially because you just presented a concept that I know from the years 2004, 2005, 2006. Back then, I spent a lot of time working with concepts like that. Unfortunately, I eventually realized that they don't always work the way I'd like them to. And I've now summarized what I just heard. The first thing I heard is that you trade predominantly Forex markets. Now, a very important question for me is, do you look at turnover volumes from the corresponding futures markets, for example, 6E, which is the futures product that tracks the EUR/USD? Do you do that?
I haven't done that yet. So I always check the volatility beforehand, for example, looking at the S&P 500 index. Just to be sure, exactly.
Okay. Why exactly do you check the S&P 500 index when you are actively trading the EUR/USD pair?
Just to see. I'd picked that up somewhere, really just to see if the American market is doing well right now, whether it's trending long or short overall. I was just curious to get a better sense of the current landscape and see how things are actually playing out in the market.
And what would you say, what impact does that have on the EUR/USD currency pair?
Well, I'm still in the process of finding that out.
Okay, then I would say that there is also a lot of work you are doing right now where you honestly do not even know yet if it is actually going to be effective in the long run. Is that correct?
Correct.
Okay, so then you mentioned that you actually go ahead and predefine these so-called zones before you start the process. Is that right? How do you do that?
So basically, I start with the weekly and then click through all the time units. So H4, H1, M30. And first, I look for the overall trend for the day. And if I then discover nice trend lines with at least 3 contact points, I draw them in. I draw in zones from the previous day, the daily high and the daily low from the previous day.
So, you begin by pulling up the weekly chart, and from there, you take your time to carefully analyze the overall trend direction for yourself, before moving on to any other steps. Did I understand that correctly?
Well, first of all, I'm going to see if I can draw some nice clean trend lines right there. Exactly. And then I look at the overall trend.
For example, like this. It could be like that now. Then you like it when you have 3 contact points, I understand.
Exactly. At least 3.
At least 3.
What does it mean for you when you have at least 3 contact points?
So for me, it means that for my probability, it's relatively high that if it comes back again, it might break out.
Very good, then I'm already very glad. Okay, there could be an assumption, for example, that there's a break at this trend line on the 4th time. Okay, great. Then you mentioned H4, so the 4-hour chart. Why do you use the 4-hour chart?
I just got into the habit of clicking through the different time frames to see if all the time units actually align.
So that means you'd also check the 4-hour chart now to see if the same trend structure is currently present.
Is that correct?
Correct.
It matters.
I mean, feel free to say if that's wrong, okay?
It's right.
Okay, so I am going to go ahead and double-check the trend here as well, just to be absolutely certain.
Good.
Now let's move to the next timeframe, which was what?
H1.
And what do you do in the hourly chart?
Well, in the hourly chart, I basically look at how the market developed during the morning.
When is morning? Let's define that briefly.
Well, I trade from 9 to 12, and I'm basically waiting for 9 o'clock, and before that I just do my analysis. That means I look at what's been happening since 8 o'clock.
Aha, so you look from 8 to 9 to see what happened during that time. Okay, let's call that the pre-session. Is that okay? Well, pre-market. So what result are you hoping to determine for yourself in this hourly chart?
Well, ideally, all timeframes should align, and during this 1 hour, I check if the price is already moving specifically toward a zone I marked from the D1 and H4.
So there's also a daily chart, D1?
Exactly.
Right, and you just mentioned a zone there. What kind of zone? We're talking about support and resistance here. How do you determine that?
Well, basically, the way I approach this is to see if the price repeatedly approaches a specific zone, a certain price level, if you will. And if it keeps going back there time and time again and bouncing off from both above and below, then that is definitely a zone for me.
Hmm.
And then once I have identified that, I look at the smaller timeframes to see exactly how often or how long the market actually stays there, which gives me a much clearer picture of the overall trend.
So let's say we have a daily chart here, and over the last 7 days, it's hit a price range like that once, twice, 3 times, maybe even went slightly above it and then back down again.
Is that okay?
Okay, so you're essentially defining a technical area where you can see a reaction is happening.
Exactly.
Okay, great. Now let us move our attention over to the main trading chart, which we currently have set up on a 5-minute timeframe for a closer look at the price action. Did I get that right? Okay, so what information should we be looking to include in the 5-minute chart right now? First, consider the broader context, like the fact that the weekly trend is long. For example, let's just say hypothetically we are also looking at the daily timeframe. There you've built support and resistance, resistance, support. Okay, now we have the 4-hour chart, and in the 4-hour you do the same as in the daily chart.
Exactly. Okay.
Good.
And if I now also add the trends, which is what you do in the large timeframe, then you assume that if, for example, after 1, 2, 3 points of contact a trend is running, that it will eventually break, right? Now that you've successfully localized something like that, I'm curious, how exactly does that fit into your overall concept?
Once I've marked my zone and I see it's breaking through now, or it's running towards that zone, then of course I look very closely. And if it were to break out through the trend line, for example, I basically always wait for the closing candle. And then in this specific situation of a trend, I would place a limit order at about half the candle. So if the candle, let's say, breaks through like this, and then—
5-minute candle.
Exactly.
The 5-minute candle breaks through a trendline from the weekly chart. Okay, now let's say it breaks through like that and makes its closing price here.
Right.
Okay. What information do I still need now? From this, does there also need to be a resistance level from the daily or 4-hour chart here?
Well, that is actually the point where I determine a bit more about where the price could potentially go.
Super.
Exactly, that would be more my take profit or my stop loss.
Okay, that would mean, let's say hypothetically like this, is that alright?
Yes, okay.
Let's start by placing resistance at the top, as it acts as a ceiling for price. Meanwhile, support levels are quite useful for determining where the market might find a floor, helping us better understand where the market can go. I think that's cool. And so now we have this supposed entry signal, and what you're saying is that you would place a limit order roughly in the middle of this specific candle, Just to get a better entry price.
Exactly below the breakout.
That means a limit sell order goes here now. If the market now runs down here and goes up here, you basically let yourself into the market passively via a limit order. Get played in.
Exactly.
Okay, super. Right now, the market is at a critical point where it will either push above this level, which would trigger your stop loss and get you stopped out, or it will follow the path you anticipated and run down to the area you pre-planned. where it would finally reach its take profit target down here. How often do you even have a trade like that?
So, specifically breaking out of the trendline, that doesn't happen that often. So I just generally look to see if it— I basically look for my zones there. That means if it were to run into a zone like this now and was no longer in the area of the trendline, because you missed it or whatever, and I see that it's basically running into said zone, then I first look at, okay, what's the market doing there? How long does it stay there? And if it stays there longer, let's say at least 4 or 5 candles, then I look at, okay, what are the candles like, are the wicks long to the downside?
That's a different strategy, isn't it? I'll go into the strategies in a moment. Now we have a new 5-minute, 5 minutes again. Who actually told you that 5 minutes is a good timeframe?
I actually did that based on my gut feeling.
Gut feeling, okay.
1 minute is a bit too fast for me sometimes, and 5 minutes, I can still wait for a 5-minute candle like that without getting impatient.
Okay, now just briefly on these 2 levels here. They come from the daily chart and the 4-hour chart, where a market has repeatedly hit and shown you a reaction. Okay, great. Let's pause our analysis of this specific strategy for just a moment. Let's officially call this one Alpha. It really is a fantastic strategy. Now, let's shift our focus and call this second option Beta. That is our second great strategy, and it's equally important to consider. And with this strategy, you're doing the following now. You have to explain that to me.
Okay, so in the end, I also look at where the market is. It comes, let's say, down to this zone and then forms about 4 or 5 candles. And then I look at what the candles are like. So are the wicks far down? Are the wicks far up? And then I mark the zone again specifically from these candles.
How do you define the zone?
I pay attention to the bodies. So there too, I look at the ratio of the candles. Where are the most points of contact? If all the wicks are in one place, that's a signal for me where I say, okay, I'll draw my line there. If, for example, all the bodies are on one line, then the wicks aren't that important to me. So always where the most points of contact are.
So, and then you would, for example, define this zone like this. Is that right? Okay, great. What's the next thing you want to do now?
Good, then I wait again for a 5-minute closing candle that leaves this zone either to the upside or the downside.
Let's go ahead and imagine the following scenario, and you will see that the candle actually looks exactly like this.
Exactly. And then I decide to enter the trade either by a market order or alternatively by a limit order placed right at the halfway So you always take half of the candle, limit at 2.
Where would your stop loss be now?
Well, my stop loss would be below the zone.
And now, let's just say, hypothetically speaking, that the market actually hits your order and is sitting right here at this specific level. Where is your profit target? What you define as your take profit target?
Well, I first check if there's a zone there or if the path is clear, if there are any obstacles.
But you already did that before, right?
Sorry?
But when I—
yes, exactly, I did that before. I also marked the previous day's high and low, and if I happen to see something standing in the way, like a significant psychological line or perhaps some key round numbers, then I also carefully watch how the market behaves in that specific area. Based on that observation, I either decide to let the trade run, or I simply get out. But generally speaking, I prefer to let the trades run their course once I have fully committed to them, as that is usually the best approach for my strategy.
Do you do that? Or are you just telling me that?
No, I really do it. At first, I had trouble with it, but now I occupy myself with something else, so I don't mess with it.
Okay, now I have a question about that. So, in this specific scenario, we would be looking at a hypothetical risk-reward ratio of approximately 1.2. It is a solid setup, but I'm curious to know, how many actual trades have you executed using this specific concept so far?
I've done 240 trades in the Euro-US Dollar.
240 trades. What's your average risk-reward ratio over those 240 trades?
The ratio is set from 1 to 1.28.
Is that planned or actually executed?
That is just the average figure. When I first began executing those 240 trades, I consistently relied on limit orders for every single entry. I found myself getting quite frustrated and annoyed whenever the market moved away and I simply didn't get filled on my positions. I didn't like that. So I eventually settled on a combination of factors where I just take a moment to look, and then I decide based on my gut feeling whether to go in at the market or not.
How would that gut feeling manifest itself, for example? So what would you do there?
Well, if I'm at a zone, for example, and a nice hammer appears and then a flash, I call it a flash.
What's a flash?
For me, a flash is really just a quick, refreshing break from the EMA 5.
So what is the flash exactly?
The flash is basically when I have a nice candle here, let's say like this, that closes above the EMA 5. That's a flash for me, and then I get in immediately.
Blitz setup, that's something new. I think it's cool. I always enjoy stuff like that. Great. How many trades have you actually analyzed based on these key figures? I mean, to get these numbers, because you just said that you did different trades at the beginning.
It's kind of mixed. So, with these 240 trades, I tested all those things together. At some point, I started testing the Hammer and the Blitz explicitly. I think I only had 40 trades for that. And then, because I realized I wasn't getting anywhere or was still missing information, I tested each of the individual strategies again on top of that.
Okay. And testing the individual strategies separately, what kind of key figures did you get there?
I actually forgot that.
It is, quite frankly, the most important essence of absolutely everything. But honestly, it is really good that you finally realized that you have to test all of these different strategies individually, one by one. Did you get a mathematical result from that where you could see, hey, this is the strategy that works by far the best?
Well, actually, for the Hammer and the Blitz, I had, I think, a 70% success rate.
At what average risk-reward ratio?
That should also be around 1.2.
It should be, yeah. Honestly, I would really have to go back and check my records again just to be absolutely precise about that for you.
Okay, good.
Now, I would actually like to rewind just a little bit and share a few key ideas with you that I really hope you will take with you as you move forward. The first thing I saw, trendlines are for oddballs, as I always say, or so I've heard.
Yes.
Do you also understand why? Look, sideways phases are based on the fact that many market participants can do their business there. Trends are nothing more than fast, impulsive movements that have an origin, economic news or whatever. Now, a trendline would have to be designed in such a way that it's a uniform result for it to even make sense mathematically. But the truth is that a market trend usually follows a predictable path like this, and now we have a new trend line that is clearly going like that, which changes how we look at the data. And now is the moment where it breaks. And now I come to my first question. It's certainly often the case that it quickly runs back, right? That's because the market is running into a previous sideways range. Therefore, please never take trend lines in isolation, but I would absolutely recommend you start Defining your charts by balance and trend, and then—
No.
Just say it.
I just need to add, that maybe wasn't quite clear. So I always make sure that I get a second signal to go with it. So that, for example, when point 4 comes up, I definitely want to see a zone there too, which is what actually confirms it in the end, right?
No, the opposite. Because if the trend breaks quickly, it has to be below that. So the confirmation would be this here, because that way the liquidity would shift downwards, forming acceptance of lower prices. And then it makes sense to trade this trend continuation. A direct trend break is always fraught with very high risks if you can't read it. And that brings us to the first topic, whether there's liquidity in it or not, because otherwise you might quickly have a move and nothing happens. And to explore that topic, I would definitely suggest you move away from the Forex market and look into Volume Profile stuff in combination with P and B concepts, where you then have the ability to recognize where there's real liquidity and where there isn't, just as an idea.
Yes, that sounds sure.
The second thing to consider is that you trade absolutely everything. Yes, so you mentioned that you trade counter-trend setups, trend continuations, and really just about everything possible in the market. It is quite a comprehensive approach to trading. You want to do a lot, but you don't have clear key figures. Which of the strategies is A, the most mathematically valuable, and B, how do I feel about these strategies? Because usually you should specialize in something that you have a good feeling about. That's what I would recommend to you. Then the zones you determine from H4 and daily, I think that's great because if you don't use profiles, don't use volumes like we do with our business zone, for example, we still check whether there was liquidity in there or not. But if you do it that way, and also as you said, take the candle bodies as alpha and not necessarily high and low, that's very smart. You can also see that if you look, I've done many analyses showing that the profile is often roughly in the middle of these bodies, and the value areas are at the top and bottom. So the equilibrium areas above here would be imbalance, and here too. And that's how it makes sense to determine something like that. I think that's strong. I find candle formations in the 5-minute chart very problematic because if you were to learn to read whether such a candlestick shows you where the greatest liquidity is, either here or here or here. You have many more possibilities to find out if the market is playing towards liquidity because it does that with the highest probability. And via a footprint chart, have you ever heard of that?
Heard of it but never actually used it.
It simply shows you how many buys and sells have taken place in the past, and then you can see more clearly where the probability is higher that things will go this way because a hammer Well, it can look like this, and there might be high liquidity here while there is absolutely nothing here. Then it often does this move. Maybe you have experienced that before. That is because you do not know where the liquidity is located. 9 to 12 is a trading time I would use for DAX futures or, for example, the Bund, because that is the core cash time for the stock markets before the lunch break. And so it is not a bad idea to use this time because naturally liquidity, more liquidity flows into the corresponding currency. But without making it completely overcomplicated here, I would also take a look at the cash timeframes of the 6E, which is the future product of the Euro-US dollar. Then you will see that you have better timeframes you can use for yourself where you can still take action. Impatience, that is honestly just a huge factor to consider. Given the current market conditions, I would most likely recommend that you stick to doing only quick short-term trades. Meaning where you can predefine that breakouts will occur or a quick counter trade, but that is rarely the case. And to say this in conclusion, and this can be used later for anyone else here: trend continuation when a market goes into imbalance usually happens quickly. By imbalance, I mean, for example, breaking through one of your resistance levels. A counter trade in such a scenario, if you see it coming here and it wants to turn, usually takes a lot of time. And that is the time when you say you would rather do something else because otherwise you will go crazy. And now moving on to the final question: exactly how do you intend to handle it? Do you check your phone often? Do you check how your trade is developing when you are not at the computer, or can you block it out completely?
Well, usually I am sitting at the computer during that time, but if I enter a trade like that where I see it is not moving directly in my direction, then I usually leave the room.
Okay, so there is also, I would say, definitely something to work on regarding the emotional component in terms of wanting to be right and enduring being wrong. Those are probably the underlying issues, but in reality, there is a hidden fear that you have done something wrong, and then you run away from it. And that happens when you use this structure and strategy for yourself in trading, naturally with a lot of emotion, because I am quite sure that even if you leave the room You will be thinking about what is happening there the whole time.
I wonder, of course, what is going on there right now.
So, I would recommend, it is not something you absolutely have to do, but I would definitely look at it conceptually to see what the story is behind it, so that maybe I do not even have to do it anymore, or I get out beforehand and say, no, it is not good, it is not working for me. Exactly. To summarize, I can say, first of all, I think you've taught yourself all of this, which is great. So I think it's really great to put in the thought to weigh the candle bodies more than the spikes and wicks and all that stuff. Then also looking for resistance and support from a multi-timeframe perspective is of course very effective, because if you see in a large timeframe that a market keeps hitting a wall, the probability is much higher than if you do that in a 1-minute chart. There are also just more often random positionings there. Then the setups themselves for entering and exiting, I don't find them quite optimal now because you simply can't see if there's liquidity in there yet. Is it at the top? Is it at the bottom? That is very, very important in order to get higher hit rates. But what is a huge drawback is that you lack the mathematical key figure for your different strategies, and you must have at least 250-300 trades for each strategy to even recognize that I have a positive expected value. It's very, very important that you do that. Otherwise, cool.
Thank you.
Thank you. So first of all, thank you very much for being here today, for giving Thank you for giving me your time and for also speaking so openly about your strategies. To learn the profession of a trader sustainably, you need much more than just a strategy. You need a common thread for yourself as a personality. And that is the reason and the path I want to take with you to achieve that. Good, so I've been able to make my decision very clearly now. I'd like to take both of you with me, you 2 gentlemen with the bald heads and the gentleman with the glasses.
Wonderful, a dream. Everything has come true. Indescribable. It's incredibly awesome to be allowed to be here. So just amazing.
With you, I have a very personal ambition to do that. Don't get me wrong, pity is not something I have. I have compassion, and I believe that this is very, very valuable for you. I also believe, after what you've shown me, that you have what it takes, and I'll give you the option for us to talk again in 2 days. Then we'll have one more person. That's just how it is then. It's important to me that you take this home with you and also discuss it with your family, because it's important to me that the format then runs smoothly, and you can judge that better once you've discussed it. I think that's also fair to the rest of those who are part of it.
I was of course very happy, and I'm still happy to be part of it. Now we just have to see that we can also walk this path together.
And I think then everyone will have taken away a lot. I have all of your stories in mind. I didn't choose based on personal aspects, but on aspects that are important to me, so that I know we'll get a huge benefit, and I'll also manage to get at least half of everyone here into profitability during this time. I thank you from the bottom of my heart and look forward to all that's to come. Thank you so much.









