I risk $250 to earn $1,212 trading… Here's HOW!
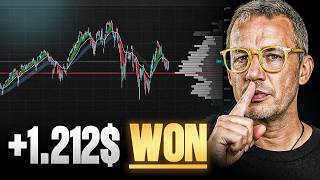
A live-recorded YouTube session by Kardec Trader explaining a specific intraday swing trade where the speaker risked US$250 and realized a profit of US$1,212.50. The video walks through market-profile and footprint-chart analysis, identifying smart support/resistance and value areas, the limit sell entry, stop-loss placement, and the patient trade management that produced a high risk–reward outcome.
Chapters
I risk $250, but I earned $1,212. How is it working? Do you know the numbers? The big numbers of trading? I will give you a lot of explanation. How does it work for you? And I will give you the chance to understand my way of trading for yourself. I recorded this live session. 100% transparent and I think you will love it. I am the world champion maker and I know what people and students need to understand the real way of trading. And trust in me. It will be famous for you to understand all these things. Please give me the chance to explain you everything. Because my English is not perfect, but I translated this video with AI that you feel more comfortable to listen my video.
Yes. In today's video, I want to show you how you too can achieve really good profits with manageable risk even with a small account. What's important is that you have the right prerequisites to plan a trade smartly in advance. And I'm going to walk you through that step by step. Today in this trade, we had a risk of US$250.00 and ended up with a profit of $1,212.50. That means, yes, this was a great risk reward ratio. And that's exactly what trading is all about. Today I'm going to show you that less is more. So let's take a look at the initial situation together. In this trade, I entered with a limit order and simply had a sell order here. I'd also like to show you what it looked like beforehand. That was the moment when I decided that below this price range here, I was interested in entering a trade on a pullback with the target down here. But why is that? And how can you determine something like that for yourself? That's the interesting question. And that's what we want to explain today. Because this trade was anything but normally predictable. Since we were at an all time high and yet I considered taking a short trade first. And the story behind it is a bit complex, but in the end it's actually very simple. Let's start first with the logic of the market profile. Just to visualize how I come up with the idea to generate a trade there. And for that you have to look deeper into the market. You have to go in and consider what's currently being played out. And this is this week. These here are weekly profiles. And what I can immediately identify and see is that the market is giving me information here that is quite special. Why is it special? I can see that we have a range here. That means the trend now seems to be flattening out. But of course this information alone is not enough to say I want to generate a short trade. The next piece of information I have is that we had a so called inside day trading completely within the previous day's range. That means we are trading within the market phase of the previous day. And that's exciting for us because then I know there's really a possibility for a consolidation to occur. But up to where can I plan for that? And that's exactly the crucial point. And if we recall the previous videos about supply and demand equilibrium and disequilibrium, you can immediately see the focus here in the this profile. Last week we had the point of control as the target area around 6763 roughly. Now you could say that's nothing magical at first and it really isn't because now it gets even more interesting. I have grouped these price areas here together and these two price areas as well. And by doing so I've really identified smart support levels. And these smart support levels are simply a combination of the value areas and the corresponding single print areas from the past. And yes, if we put this together we can pretty easily see that we're entering a price area here which is found here again where I have to say quite clearly that market participants are very likely to find initial support if the price should move downward. And so I said from up here it can go down to here. But that kaan isn't complete yet because I also need a clear boundary for the upper price area. And I identified this boundary very simply for myself by looking at the market conditions of the last two days. And I just put the highest equilibrium in context with the so called value area highs and said in this case that's the decisive price area for me. And these price areas are what I call the support and resistance levels. And I simply try to locate a good trade for myself from here to there. And now I make it very simple for myself. And how do I proceed from here? That's what I'd like to show you. Now I transfer these price areas where I know the absolute high since the market went nicely above it again pre market today and the corresponding intelligent support and resistance levels that I just introduced to you into this time frame here. In this case I chose a five minute chart. Why? Because as I said, I don't want to make a short term trade. Instead I have a very clear plan. And this plan is as follows. It goes to yesterday's poc, back to my intelligent smart support and resistance line. And then I expect the market to reach the corresponding intelligent price zone down here that I just introduced to you. And as you can see here, I've initially defined 6768 as my target level. What did we do in the next step after the market showed us that we were heading down here and with this spike also generated a certain stability in trading volume. Because if you look more closely, you immediately see that there are now interesting areas for a further move down. I said I would place a limit order specifically right below the last volume step of the corresponding price profile of the volume profile. And you can see that beautifully here. This is exactly the boundary in our order book where we can see that below this point things can move faster up here. If we start trading actively above this level again, the probability increases that supply and demand will shift back upwards. And that's exactly what we observed. We placed our limit order and then we let the market decide what would happen next. And now of course it's interesting to know where you should place your stop loss and where your take profit should go. And I'll show you that in the next image. And here you can immediately identify where in this price range you should ideally place your stop loss. It doesn't belong above the high. Why is that? I can explain that to you very clearly as well. Because the probability of a strong acceleration above the high is always high. And that's why we take a deeper look into the markets here and see where the largest volumes occurred. For this we like to use footprint charts, for example, so we can easily identify the perfect level where we should abandon our trading idea. Because the probability is simply high that the market will shoot straight up. The next thing I did of course was to set my take profit down here. And now I have to patiently wait for the market to move down there. And that's something a lot of people have a big problem with. What I now expect is the following. That the market moves from here to the old poc, establishes a reaction there and then continues downward. And for the traders and I made this very clear in the live session as we looked at it together. I said for the quick hands, meaning those who are impatient, they should first trade this short move down. That's all for now. In terms of risk reward ratio, here is the risk and here is the reward. So of course that's not optimal. Of course with trades like these you have a very high hit rate if you localize them correctly for yourself. My idea was different. I said this is a so called intraday swing trade, and I'm going to let it run. Why am I doing this? I want to make this very clear to you as well, because in the end, you have a risk that is very small and manageable, and the corresponding opportunity is many times greater. And if you calculate this mathematically, you immediately see that theoretically you can lose four to five trades with this trading style and still make money. And unfortunately, this math is often not apparent out there because most people think you need extremely high hit rates. We do have very high hit rates. But if you let a trade run like this, then of course it's a different story. There is always a chance that at some point in between it could turn back up again. But clearly my approach is to trade from top to bottom. And in this image, you can see exactly what happened when the market started. Here you can still see beautifully how our sell limit order was filled. The market did not go above our intelligent resistance zone anymore, so we had a really very small risk. And in the end, you can also see very clearly here how the market made a brief pullback after it had reached exactly this price area for the quick hands. And then we patiently decided to wait until the market arrived down here. And this waiting definitely paid off. What you can also clearly see here, for example, is that with a stop loss up here, we now have a risk of 12 ticks. We have a profit of 97 ticks. That means the risk reward ratio is just really, really high. And yes, I love it when trades go like this. And that's why we simply waited patiently this time. And patience is often a very important virtue in trading. Most people simply don't have it because psychologically they always act out of fear that the market might still move up. And you should overcome this fear by establishing and generating a lot of trades for yourself. And by simply following through with this approach, just track whether the trades under such conditions actually work out. That is when you have the ability, as we do, to clearly determine the context. By context, I mean that the market is very likely to move from this price range to that price range. Why is that? Because these levels were simply played by large market participants. And if I want to read the traces of big money, I can clearly do so using market profiling. In combination with the corresponding footprint chart, I can create this route planning for myself. And whether the market goes even lower down here or not at that moment, I honestly don't care, because the mathematics and logic of this trade are simply on my side. Yes, and here at the end, you can clearly see our executions were here. This is where the sale took place. And here we bought back our short position. So the executions are clearly visible. Both were done with limit orders. So you could have basically ignored the market. And the market just did what it was supposed to do and that was it. And with this trade, we simply generated our profit. The whole thing was very stress free. And as you can see, there were several opportunities down here for high frequency traders to establish this trade for themselves as well. Isn't less, sometimes more. And to take a risk of €250 once in order to earn over 1,200 in the end is really a wonderful story. And if you think a bit more about the mathematics of trading, you'll realize that often less is more. And you should allow yourself to develop the feeling that patience is a truly great virtue for establishing these trading styles for yourself. Thank you all very much. I hope you enjoyed it. Getting to know such an approach with logic and reason. And I'm already looking forward to enriching you with my next stories so that your trading might become a little easier. Thank you very much.









