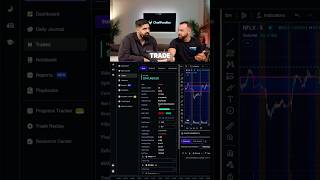
YouTube trade breakdown by Kardec Trader (video titled "Making $140,000 in a Single Trade! (Full Breakdown) 🔥", June 23, 2025). The speaker explains a successful Netflix swing trade: identifying a break-and-retest rejection on the 4-hour and 1-hour charts (key resistance ~940–950), using Daily 20 and Daily 100 SMAs as confirmation, and sizing the position (about $82,000 deployed, ~$35,000 risked). Timeline references: key support tested Feb 25–Mar 5, decisive action beginning around April 3. The walkthrough focuses on entry trigger (retetst rejection), stop placement (above 950), and rationale for choosing puts and a swing trade.
Questions this video answers
About $35,000.
About $82,000.
Approximately $940–$950.
Around February 25 to around March 5.
Around April 3.
Chapters
This was a massive trade. This was actually a swing trade. You can see I risked about $35,000 on this trade, put about $82,000 in the trade. It was a break and retest rejection. That was the playbook. So what we're looking at here is the four hour chart on Netflix and we're going to go ahead and spot where are those key inflection points on Netflix. Right? And so looking at this chart, we can see that right around here, around February 25th to around March 5th, we have a very clear area on the four hour chart that Netflix was attempting to hold above. If we break under this level, if we see this turn into some type of a rejection, retest rejection, we can now target a short at that level with this low as our stop loss. What we see here is that starting to happen on around April 3rd. We see that Netflix once again had a breaker candle underneath that major previous low. We come back into it over a few days, we channel come into it failure next day and we fail it again. So taking this one step closer on the one hour chart, we can see that just reading that action at that major level and understanding our levels, take a look at the candles that we started to see. Once Again, within our 940 to 950 area, we see very clear inability to to move higher, multiple attempts higher over two days, both Wednesday failures to move higher and rejections next day. Right, we hold that low, we push higher again and we can see a very nice one hour wick rejection candle right in that same 950 to 940 area. So after seeing that and knowing how major that rejection level is, on top of that seeing us failing, for me, the Daily 20, which is that blue line on your charts, and the Daily 100 SMA, which is your green line on your charts, I was confident to set up a put option and a swing trade, risking back over that 950 high. Because I now have very high confidence that after seeing two days fail at that same level, which was also that previous low that we talked about, I can now just say, hey, if it gets back above 950, I'm gonna have to accept my loss. That's a pretty incredible rip back over that very clear rejection point that is shown.