Master Orderflow Trading: The Ultimate Step-by-Step Guide 2026
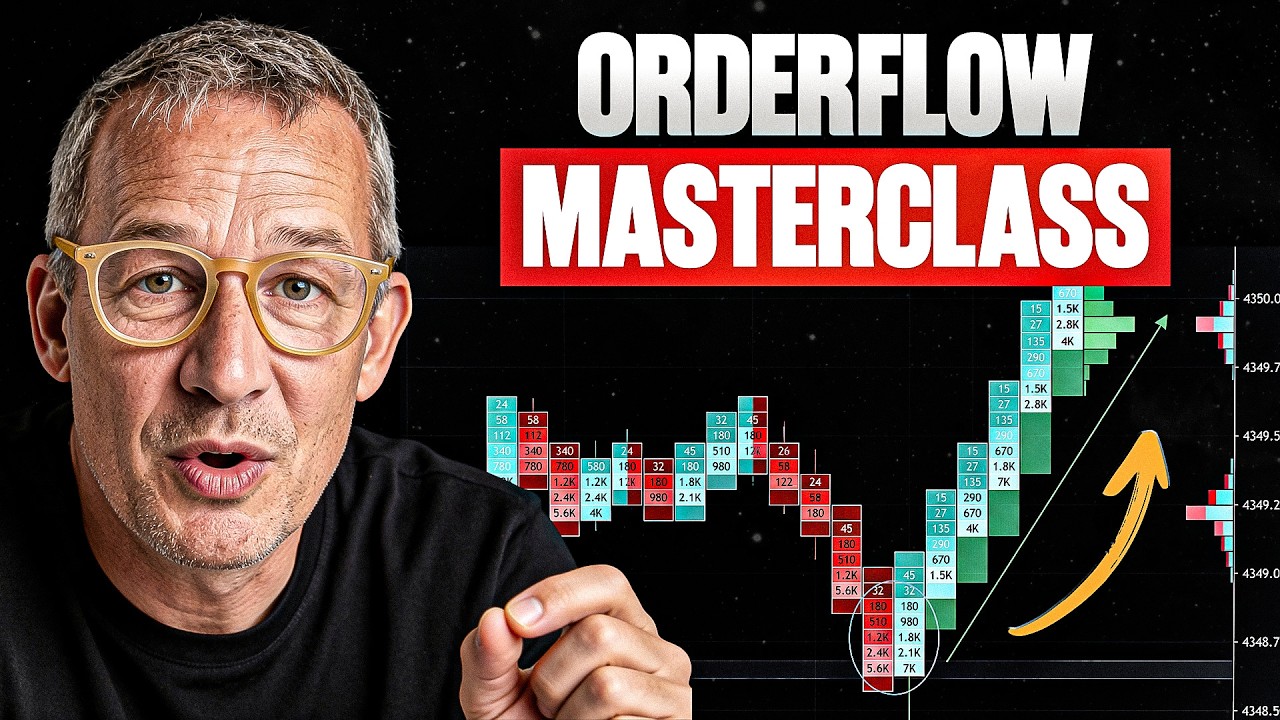
Speakers A and B teach order flow trading, which reveals who's buying and selling and where liquidity sits, unlike candlestick charts. They cover footprint charts, volume profile, and the order book, then show live examples in S&P 500, DAX, crude oil, and other markets to spot high-probability entries by reading large orders and market speed.
Chapters
Everyone knows these charts, but hardly anyone knows these. And that's exactly the difference between guessing and knowing what's actually happening in the market. In this video, you'll learn 3 things. First, what order flow actually is and why most traders never even see it. Second, why professionals wouldn't even think about trading without order flow anymore. And third, I'll show you live how to spot a market entry that you would never see on a standard chart. But until then, every trader asks themselves the same question: Why does the market always move against me? There's a specific reason for that, and it's called Order Flow. Simply put, Order Flow doesn't just show you where prices were, but who's buying, who's selling, and how aggressively.
You no longer see the market as a line but clearly as a decision. Take a look. As I start here, I want to show you the following. This is a chart that many traders are familiar with, a completely normal candlestick chart. You might also be familiar with the volume on the left side, how much volume was traded at what time. And additionally, I can of course have it displayed here how many buyers and sellers were in the volume under the respective chart at the respective price. Took place. But is that enough? No. Look here, here on the left side we have a footprint chart, and this footprint chart shows me exactly how many buys and how many sells took place at that particular time. And that's a very important indication to understand where there's a lot of liquidity and where there's little liquidity. But let's move on to pure order flow. That's what we need here. Before we dive deeper into this, let's take a look at what an order book actually is. An order book shows me how many orders are currently being offered for purchase via limit order. That means traders who place orders on the buy side, and in trader jargon, we also call this the so-called bid price. That's where something is offered. Then there's the sell side, where we also see how many orders are currently offered for sale in the book, the so-called ask side. That's why many traders always talk about bid and ask. And now you just have to imagine the following: if the market, which is currently here, makes a purchase, then we can see that here based on the traded orders. This isn't a huge knowledge advantage yet, but it's what the book shows us, with one small exception. Here you can immediately see if there's more on the sell side or if there's more on the buy side. So, do we have more positions in the bid? Are more positions currently being bid, offered to buy them up? Or do we have more positions in selling? This is initial information that helps me. If I also know that liquidity is always what the market likes to seek, I can keep that in the back of my mind. Now, for the next thing, here on the right side, we have the price of crude oil. I naturally need to know my key figures. I need to know at what point orders being offered are large and which orders are normal or small. That means I absolutely have to deal with the corresponding chart and with the corresponding product that underlies the whole thing. Because, for example, DAX future has completely different prices that are offered on average than, for example, S&P 500. You just have to know that. Let's take a deeper look at it. Here we're seeing the living book right now. What do I mean by that? Here you can now wonderfully see how the market ticks. What immediately strikes me here is a huge order on the selling side, so on the ask side of the S&P 500. Let's take a look at those. Those are 325 contracts. Let's look at the book for the DAX future. There you already see 1, 1, 2, 4, 3, 5, 3, 3. So a fraction of the liquidity that is available to us in the S&P 500. So it's clear to us, okay, markets like to strive for where there's high liquidity, and you can see it here. This is where this order was processed. That means the market ran exactly to where the liquidity is. And if I look at crude oil here, for example, similar to DAX Future right now in terms of liquidity, then I already see much, much smaller numbers. That means if I were to see a 100 block here, for example, then I know, oh, a large trader has an ambition to be filled. So he wants someone to buy his position from him. But what else do I see? And that is also very, very important. Look, this here is the so-called volume profile for the current market activity. Here is the current price. So I see immediately where the market has traded a lot of liquidity in the past and where the market has had very little liquidity. I don't see that at first glance in a normal chart either. In order flow, this is information that is very important when you look at the whole thing more deeply and know how, for example, large traders act. Because specifically, price areas where there is relatively little turnover are often price areas where rejection takes place. And if I were to see now, for example, that there's a very, very large order up here in the book, like a 300 $250, and the market in the second step, where the interaction also gives me a certain speed, there's a high probability it'll run into this low liquidity area from the past. This means that with a high probability, a fast movement will occur above this price level. Why is it fast? Because supply and demand haven't been filled much there so far. And that's why the major market participants don't feel so comfortable there. So that's an initial indication that helps me. So just as a reminder, what have we learned up to this point? This chart here basically just shows me that it's currently rising, but this is the current price that I can see in the order book. I can also see that there was very little liquidity here, so it's a very thin area. The probability is relatively good that something fast could happen there because the major market participants have little interest in keeping the market in balance. Now, in the next step, I see that there's a very, very large order here. This means the probability of this order being filled is very high because markets tend to strive for liquidity. I know that spoofing used to exist and probably still does sometimes, and that it's possible for such an order to be a fake order and get pulled. But let's stick with exponentially large orders. They're usually real because someone has the ambition to do something there. As for why, we won't debate that here. I can do that in another video, but that's just a fact. So we have the information that the probability is high that the market will fill it, just as we've seen live. And here you can see beautifully, yes, it was filled. Yes, the market has completed an upward movement. And what I see here right away is that the next large order is in the book. Now, there's Level 2 data, and there's also what's called Level 3 data. You can see many more orders there in the book, up to 100. I don't even know exactly how many you can have displayed above the corresponding ask price or below the corresponding bid price. And that gives us information on where there's a lot of liquidity. It gives us an edge, and of course, we love to use that edge. Let's go live to the market for a moment and see what exactly is happening at these price levels right here where the market just played this large order. You can take a look at that, for example, draw a reference line and say, okay, I'll keep this area in mind, 7,596.25, and I know, aha, a very large order was played here. Now the question is always, is this someone who entered or someone who exited? How was this order filled? As a block or piece by piece. That also shows us which traders are currently active in the market. This information that a large order has been traded there, you'll see this again and again. It gives us clues because as long as the price is above it and buying continues with speed, there's a high probability that the market has something bigger in mind, or the market participants, a larger market participant. And that gives us indications Besides, you very often have the possibility at such price levels that a major balance occurs there, because the market will keep checking if liquidity is still present. And all of this is information that helps us move forward for now. And here you can get an impression of what a desk looks like, for example, for an order book scalper. He has many markets here: crude oil, Russell, NASDAQ, S&P, DAX future, Euro stocks. And so on and so forth. Here we have gold, here we have Bund future, here we have ZN, and all these values, as you can see in the books, 5,000, 6,000 positions in the bid and the ask. Now we have something completely different here as a counterpart. For example, let's take the gold price, for instance, and here you see contract sizes that are offered for buying and selling of 2, of 4, of 6. That is, of course, well, let's say a massive difference. And if you want to learn to read how a book really works, then I can recommend taking liquid markets such as bond, such as ZN, such as the Euro stocks, such as the corresponding currency futures like 6E, 6B, which is a bit more illiquid. There you can learn to act with the corresponding large market participants. You can learn to read there how is it, at what speed is it. When you hit into the markets, you'll notice that there are speeds. Some of these speeds are high speeds while others are low speeds. And as I mentioned, one strategy that I want to keep showing you is the use of big orders. And if you locate big orders for the corresponding market, then you have an information advantage. And this information advantage gives you the ability and the opportunity to read that the probability is high that a market will strive in this direction. And if it doesn't, then you have to watch whether this order remains or whether it was perhaps quickly reduced because this market participant absolutely had to get out of his corresponding positions. Very often that doesn't happen. Very often the position remains and thus gives us a direction So now we know, we can see where markets are currently in balance or in imbalance. How should market speed be viewed in relation to the respective product? You have to learn to read that. You can paint the charts in your head, but you can also go and mark corresponding levels in a chart where large volumes were generated and then observe there when the market gets there. Are there still large volumes or is it all done? If there are still large ones, the probability is very high that the market will keep striving there that day because it gets large liquidity provided there. And last but not least, look at when these big orders are in the market, at what speed they are being bought or sold. And if you put something together from these building blocks, then you have a big advantage over just a simple conventional chart. And that's exactly what was very important to me to explain to you once in detail. Thank you very much for your time.









