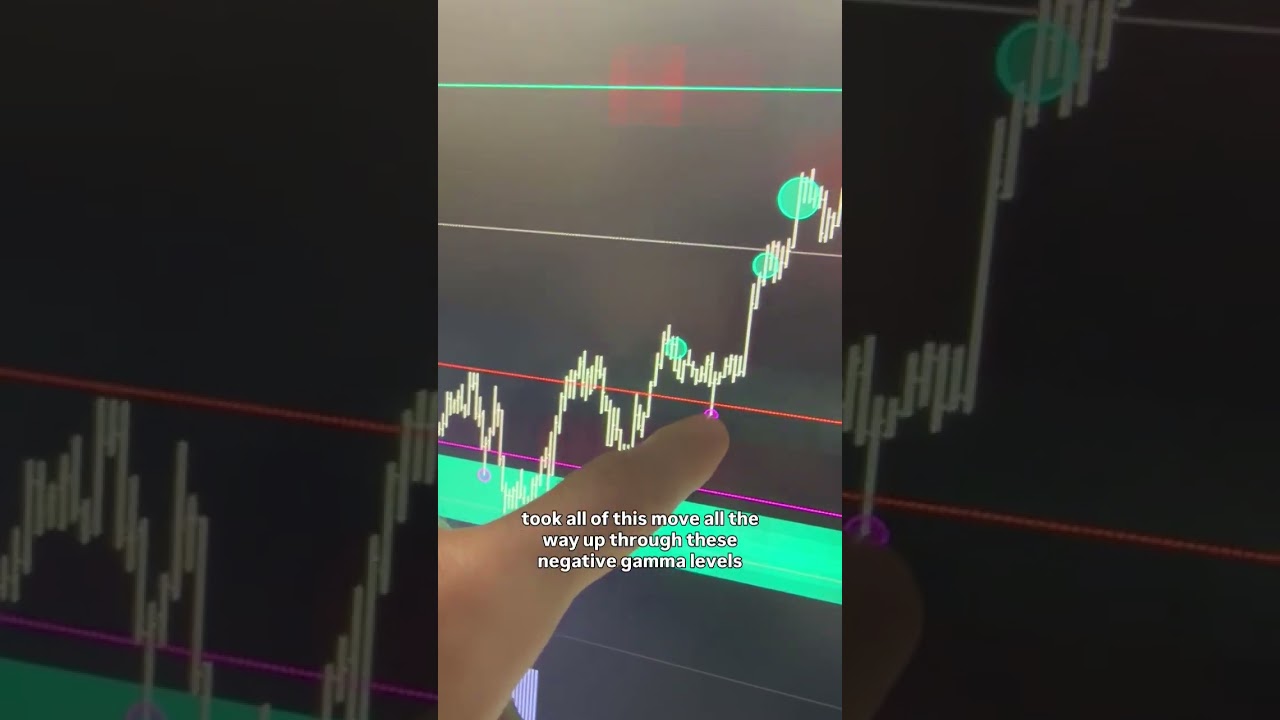
After GDP and PCE data, price broke out of a value area as sellers got absorbed and buyers pushed through negative gamma zones. The presenter shows how combining order flow and options flow data pinpoints exactly where the market will move, using the DeepCharts platform.
Chapters
What a session. We started today's session with a very strong bullish move after GDP and PCE data. Price had already broken outside of a value area, and sellers were getting absorbed like hell. And there was a huge gamma level carried out from previous sessions that held the market at bay. And as soon as we broke out of the opening range, we saw aggressive buyers stepping in, sellers being absorbed at the put wall, And we took all of this move all the way up through these negative gamma levels that would contribute to the expansion of volatility and stopped right at the call wall. The precision that you can get from order flow and option flow combined is unmatched. Prove me wrong. And we saw all of this live on DeepCharts. So if you don't see the live sessions we do on YouTube or you're not in the DeepCharts community yet, comment deep and let's fix it.