PbD: The World’s BEST trading strategy (explained in detail)
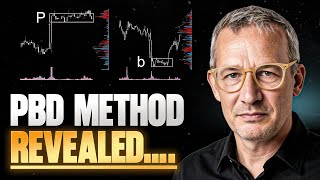
Kardec Trader explains PBD, a trading method using market and volume profiles to spot unfair price zones. Markets spend roughly 70% of time in balance where value trading works best, while P and B setups produce trend acceleration in about 30% of markets. The strategy identifies dominance through single prints and tails, then counts closing prices to mark break-off edges.
Chapters
The totally shortcut in trading the PBD methodic. I explained you today, how does it work? And I will give you not the big explanation of market profiling, volume profile, vwap and anything. No, I have done everything together and prepared the PBD logic and I think it is very easy to understand and it feels very good because you understand the knowledge of this strategy. I translated this video with AI. I'm not an English native speaker, but I have done my best to make a very good job for you.
A beautiful day to everyone. So what do I want to share with you today? I want to tell you a little bit about the PBD logic. About the logic I developed mainly to have something in the markets that makes sense to me, especially over multiple time frames. And how did I come up with it? I simply delved very deeply into market profile and volume profile where on the one hand you can determine who is currently currently dominating the market and on the other hand you can see where the breaking points are. So what did I do then? I then analyzed thousands of patterns and setups for myself back then and observed isn't there some way to capture all of this technically? And I found these possibilities and I want to explain them to you because I can tell you it's very simple. You just need to know one thing and that's exactly what almost no one does. This logic applies to around about 30% of markets. The Ps and the Bs are both structures, setups that typically cause a market to accelerate the other 70% in the so called balance phases. Sideways markets, those are the market phases where you can trade value short at the top, long at the bottom. And I actually shared this story already. Wow. I don't even know how many years ago that was published and demonstrated it in Traders magazine back then, but very few people understood the connections. And that's exactly why today we're going to take a look at these connections together. Let's take a look together at what we can see here. This for example is a typical market profiling. Why market profiling? What you see here, that's the volume profile and the gray areas you see in these wonderful blocks, that's the corresponding market profile. That means we layer them on top of each other. And with that we have two possibilities. On the one hand we have the option to see who is currently dominating the market. For example here, with such a selling tail, aggressive sellers, how much time has the market spent at certain price levels. With this we can identify who is currently dominating the game, who is active in the market right now. The second thing we can identify is through the volume profile, where are the price areas where the market has so called low volume nodes, in other words, zones where the markets slip into imbalance. Because as I already explained in the volume profile we always have to consider where is the market unfair and where is the market fair priced. And it is precisely this logic that I have incorporated into the PBD logic. Now there are different market structures, there are so called balance profiles and so called trend profiles. And now it is very important for you to understand that financial markets typically operate in these normal market phases approximately 70% of the total time. And now the question may arise, what do I want with a strategy that only operates in trending markets? And I have to say very clearly, no, just imagine the following. Just imagine that all of a sudden you have the opportunity, for example, at a price area like this one, as you can see beautifully today, to get a setup where you can see there is real strength behind it. For example, it might look like this. The market comes down, then moves steadily upward and forms a balance. What does that mean? That essentially means for us as traders, we can clearly identify that very strong buyers have come in right here. We can easily identify that the big institutional money feels quite comfortable at this level. And that is exactly why we need to go and analyze such market fragments very smartly for ourselves in the future. And I do this analysis using my closing prices. What does that mean? For example, I look at what a volume profile looks like and I need to know that unfair price areas can be found here or here. I also need to know that the value area is the price range where the market finds acceptance, where the big market participants simply feel comfortable because they can find buyers there for their trades, for the large positions they take, which can sometimes take many hours. What did I do in the next step? In the next step, I went ahead and formulated a very simple thesis and said, always there, where the market moves out of balance, that is above the value area and below the value area, I very often see candlesticks with closing prices and opening prices. That might not sound easy at first, but I'm telling you it is easy. What else did I do? Furthermore, I went ahead and examined how often in these fast price areas there was the possibility that unfair price zones prevailed there. And that is indeed very often the case. So what is the essence? The essence is that I use closing prices to locate where the so called break off edges are in the volume profile. What do I need to do in the Next step. In the next step, I need to see who is currently dominating the market. And that brings us back to the market profile. In the market profile, I can see, for example, if a market has single prints like here, then I know that traders were forced to buy very aggressively at this point. In this case, up here is the closing price and the market was pushed upwards. Down here was the balance area. This means that this price range was initiated by aggressive traders because, for example, they had to make hedging transactions or because they had some other fundamental reason for entering the market. And when I see something like this and identify it for myself, then it just makes perfect sense. And of course, up here, the market is out of balance. So what comes next? Next comes the zone, the phase where the market starts to create balance again, a new equilibrium. This means I have the information that aggressive traders pushed the market up and now they're back in a fair price range. Now, let's take a look at the whole thing. Now imagine the aggressive traders push the market up and then through the closing price count, have the opportunity to narrow down the fair price range again. What kind of logic do we have now behind it? The logic is that here the market was played extremely often with trend profiles, single print areas, and here everyone is in balance. We simply determine this using closing prices. And these closing prices can be easily defined, saying that everything above and below them are unfair prices. I'm not interested in those at all. Be mindful, don't go and use some methods to remove the candlesticks now. No, they're good. Because even the extremes always have their justification for existing. We go and look carefully. What exactly do I expect to find here, or what do I really expect to see over there? At some point the market will break out of this zone, again, probably to the upside, because the trend is aggressively upward. But there's just as much of a chance that we go downward. And now we absolutely require substantial evidence and confirmation here or up here that the market will continue to move in an upward trajectory or a downward trend. And now just consider the following logic. It makes sense to watch for new closing prices forming up here, along with the corresponding trading volume volumes down here. This technical setup indicates that the likelihood that the prevailing market trend will persist is exceptionally high, suggesting a strong probability of continued price movement in that same direction. There is an interest in pushing the market back up here, and that's exactly what we do with the PBD logic, specifically in these price areas, looking at the corresponding structures, such as those from market profiling to See is what I need present here. And this is determined technically. Then we use the rules for counting closing prices, which are necessary to determine whether the trend continuation will happen or not. And to best check this explanation for yourself to see if everything fits. I always like to use this graphic for illustration. Assume this is now a setup that can form here. So below the range. What do I expect there? I expect the market to move downwards again out of equilibrium. But how can I pinpoint that? So if I have a setup there that looks like this and the market goes below the range and then back in. Yes. Then the probability is initially high that it will go back up. If the market gives me a setup below there that looks like this and breaks out upwards, the probability is high that it will go up. What am I trying to say with this? So if I am right here at this exact price area, let me make this a bit clearer. The market drops down and gives me a P. And now I have the opportunity to recognize that buying is happening again. Yes, Then it will continue to go up. We call this a break in. But now there's also the following possibility that the market suddenly goes back down into the range and moves lower. Oh, so there is a possibility for a trend reversal via the P. Or I have the setup like this and I get confirmation by the closing price that we are moving downwards. So I know my next target is below the start of the impulse. And what can we do then? Then we can identify for ourselves that even though there was a bullish setup here, we can now plan a trade up to this point. That means with the PBD logic you have two possibilities. On the one hand, you have the option to logically understand why these patterns make sense for you. And secondly, you can simply apply them at price levels where you identify, do I now expect a trend continuation? Or do I rather expect the trend to end here? And then you use this P setup or the B setup for exactly the corresponding structure. There is also the D setup, and the D setup is nothing more than a profile that the market has formed, which looks like this, for example. And through the closing price count, we notice that our continuations are no longer happening. We get stopped out maybe once here and once there. Now the market starts to form a balance that the market goes short at the top and long at the bottom because market participants simply no longer find exc acceptance here. So you can use the patterns to re establish trend reversals back into the fair price area. And that's the logic behind it. And in my opinion, it's brilliant. And I hope this helped you understand a bit more clearly how we use the PBD logic for ourselves and how you can now use them in depth for yourself. I was glad to present this to you today, and I hope it brings you a lot of clarity in your trading. Thank you very much for listening.









