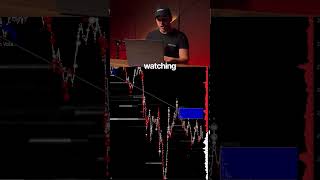
A trader shows how to read Nasdaq liquidity heatmaps to spot where buyers get absorbed and fresh liquidity reloads. He sets profit targets at TP1 and TP2, using order-flow signals to time entries at deeper liquidity levels and gain an edge on execution.
Chapters
we have here below this level of liquidity and we have this cluster. So we have TP1 and TP2 here. Okay. And today the NASDAQ unfolded collapsing like this. Now, what can you notice? You can notice that you have liquidity heatmap level here, okay, removed, putting lower. What does it mean? That they want to get filled and they are willing to get filled at lower levels. You see this amazing absorption. On top of this, you see reload, reload, reload, reload. This is all fresh liquidity fueling the movement down. And you can see that here you have NASDAQ effort, NASDAQ effort, area. So this is another example of how you can pair all this information that you have from the heatmap. And also when you have the confirmation, for example, on the Nasdaq effort, watching what happened from the liquidity heatmap. So seeing exactly the level that they rejected here and knowing that this pattern here on this absorption of the buyers and this reload here, it's exactly where the Nasdaq effort printed, is giving me the confidence to go to the next level of liquidity and is giving you a better timing advantage over other players. Here.