STOP Trading Candlesticks (MUST WATCH)🚨
16 Apr 2026 · 1 min
0:43
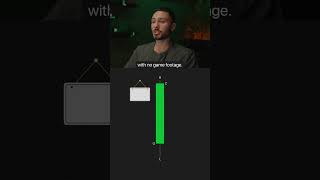
Candlestick charts only show open, high, low, and close prices, but footprint charts reveal which side was winning at each price level. Footprint analysis shows the internal battle between buyers and sellers that candlesticks hide, giving traders insight into why price moved, not just where it went.









