The 3 Must-Have Indicators for 2026! (Revealed by Trading World Champions)
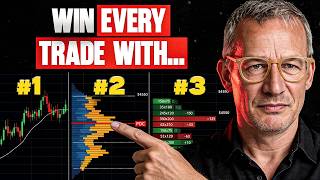
Thomas Voivald presents three indicators for 2026 trading: using major newspaper headlines as contrarian signals, mapping volume profiles to find price reversals, and spotting volume spikes that signal exhaustion. He illustrates each with DAX, crude oil, and Bitcoin examples.
Chapters
The 3 indicators you must have in 2026. Why? If you choose these indicators, you will be able to think deeper what happens and what is working in the market, how you can combine them and how you will be able to take these indicators for yourself. You can use it very simple. Who I am? I'm Thomas Voivald. I'm the Champions Maker. I trained a lot of big traders in this world. For example, Patrick Nilsen, 2 times World Cup Championships of trading leader, or Christoph Radeker. All of them are working with my knowledge and they love it because this stuff I explain you today is very, very, very comfortable for you to use.
Yes, there are many things where people like to refer back to the past. We humans love pattern recognition. We humans love it when things are similar, like attracts like. That doesn't quite fit, does it? You can really only work with probabilities. You can identify indications for yourself by finding out where global money is in the markets. There's also the nice smart money concept, but I can tell you there are much simpler ways to be able to clearly explain where global money is, where it's in imbalance, how to deal with it. That's one thing. The other thing is, how do I get advantages in the market? Which information sources can I feed myself with? For example, I always read a newspaper for that, and that's exactly what I'll show you now. And don't be shocked, but first research whether there might be something to it. Let's start today with something that at first glance has absolutely nothing to do with trading. But let me tell you one thing: when such wonderful publications as the Bild newspaper publish something about stock trading, that's the biggest counter-indicator you can possibly imagine. Look, this Monday, for example, Dear Trump got a wonderful little picture here. Did it have anything to do with Trump? No, instead it said there, "Today a Black Monday threatens us." And people who have been dealing with the stock market for a long time, they know there have been such Black Mondays and so on. And there was then an emphatic warning against investing in stocks because they are dangerous. And now you have to make two distinctions. First, is it a geopolitical report that newspapers like the Bild newspaper publish that has a long-term effect? Or is it a short-term effect? Of course, you have to be able to distinguish that first. And I can tell you, political stock markets have short legs. And it's always the case that you have to see how sustainably I can evaluate that. Now, I can tell you, you can evaluate such a message very well for the day. Now, there's part 2, and that's very, very important for investment strategists. If you read in such wonderful magazines, for example, that stocks are the most dangerous thing ever, how can you even invest in them? How can it even be possible that Germans fall for it again and again? Then that's the moment when you can buy, and for the long term. But these geopolitical topics here, they are always wonderful for a short time. And I want to show you what resulted from that. Look, that's the DAX on that day when this news was published. Why was it published? Because there was a gap, a gap downwards, because Trump had predicted over the weekend that he would block the Strait of Hormuz, or rather wants to control it. And for us in trading, that is the absolute best counter indicator because we know that the probability is high that the market will do the exact opposite. And that's exactly what happened here. Therefore, our first absolute counter indication is major public newspapers, those widely read publications that try to suggest something to us, especially if it is related to either fear or greed. That's how it is sometimes, that such nice events like Bitcoin and so on were promoted in these magazines. Shortly after, as we all saw, the Bitcoin price was cut in half. So that's the first thing we see. The exact same thing, by the way, also happened with crude oil. Crude oil also entered the market with a gap, and what did it do then? It fell down. But let's take a look at how all of this helps us, and let's move on to number 2. Number 2 is volume profile composite. What do I mean by that? Just load all the data you see on the left side relative to the current price. That means what data is above, what data is below, and what can you derive from that. You don't need 4 or 5 years of data, just all the data from the last major high to the last major low. Those are the ones that are interesting for now. And then you can see, this is the corresponding volume profile, and this volume profile really gives you great information. It tells you you immediately where larger market participants had longer holding periods and where larger market participants ultimately had the exact opposite. Those are what we call low volume areas. And if you just draw in these high volume areas, you'll see that the market repeatedly triggers reactions there. Now, if you go ahead and do the following and draw in the absolute low volume areas, you'll find that the market provides great information there as well, because those are the areas where rejection occurs, where prices simply become unfair. Because you have to know one thing, and you can see it beautifully here again: the market likes to reject such low-volume areas and runs back to liquidity. The liquidity is right here. This is where the big market players can calmly build up and wind down their futures positions. This is where the major market participants from the large stock blocks, the index trackers, and so on can exchange their positions in peace. Therefore, you can always assume that when markets are in such low-volume areas and there was previously like here, this volume profile was created here, the possibility to base forecasts on it. Then you will repeatedly find the opportunity to return to these high volume areas, and that will continue until a market starts to build a new high volume area. Because what does it do then? Then it changes the supply and demand situation, the fair prices. For this, very importantly, always look at the expiration dates of the respective contracts. Both for the major expiration, which is very exciting, but also take a look at the options because they are rolled much more frequently. And there too you often find interesting price ranges where markets were in acceptance for a long time, where you then gain an advantage for yourself. So point 2, volume profiles in the composite concept, which means long-term oriented, they definitely help you better to be able to recognize where a price is fair. And the market will try to go back to the fair prices because it simply loves fair prices. And now we come to Variant 3, and here I do nothing else but smooth out the volumes for myself. That means I go ahead and draw an average trading volume in here. I think everyone can recognize that immediately at first glance. These are the volumes here now in a longer-term daily chart, and whenever you see that volumes are rising exponentially, then we usually have something to expect in the markets, and very often it is the opposite of what we assume. Look here, look here, look here in particular, and look here too. The market has always, when it came to extremes, first performed a turnaround. Why is that? It's simply because, as I like to say, the markets have then exhausted themselves. This means that large liquidations have simply taken place, and as a result, the market participants are exhausted. And after exhaustion, what usually happens is either a move higher, then exhaustion, followed by a move down, or sometimes it is high exhaustion, and then sideways movement, acceptance of new circumstances. Here it can then be that the market also continues to run upwards if it goes back above the exhaustion levels, or else— and this is the more common variant— that with volume spikes you have the possibility to localize where a trend is interrupted for now. I know that was all super simple, but it's allowed to be simple, and it will help you, I promise you. If you use these simplest methodologies and log logics for yourselves. And if you are hoping now to get some mega magic complex indicator or the wildest dynamic concepts, stop it. Go into the basic idea of supply and demand, and you will realize that this really helps you further. Always think outside the box. We could now look at the Fear and Greed Index. There too, it's always the opposite of what it shows. But even there, one must clearly say that it doesn't necessarily have to tip then It can be the same with fear and greed, as we just saw perfectly with Bitcoin, which was extremely oversold, and this move here didn't even happen. Instead, the market entered a sideways phase first, and that's also a way for extremes to level off. So it's very important to always check if the extreme is accompanied by a corresponding reversal signal or a sideways phase, because extreme momentum also dissipates then. Or builds up depending. So feel free to leave a like if you enjoyed this, and I'll see you very soon. Bye everyone!









