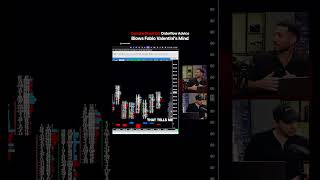
Use range footprint charts to read market speed. A bar that opens in 30 seconds means high volatility and strong momentum. A bar that takes many minutes to move a small range signals choppy, low-volatility conditions where you should stay out.
Chapters
So one thing that I look for and why I love using a range footprint chart is I like looking at the time the bar opens. So if the bars open relatively quickly, you see here at 11:03, we have a bar and the next bar opens up 30 seconds later at 11:00:40. If I see a bar maybe take 20 minutes to open and move a 5-point range, that tells me that it's very choppy or there's not a lot of volatility. Interesting. I never think about— So I like looking and, you know, if I had more screen real estate, I would have another indication down here that tells me how long until the next bar opens. And when more bars open more frequently, I know that the speed of the tape is, you know, increasing as well. Nice one.